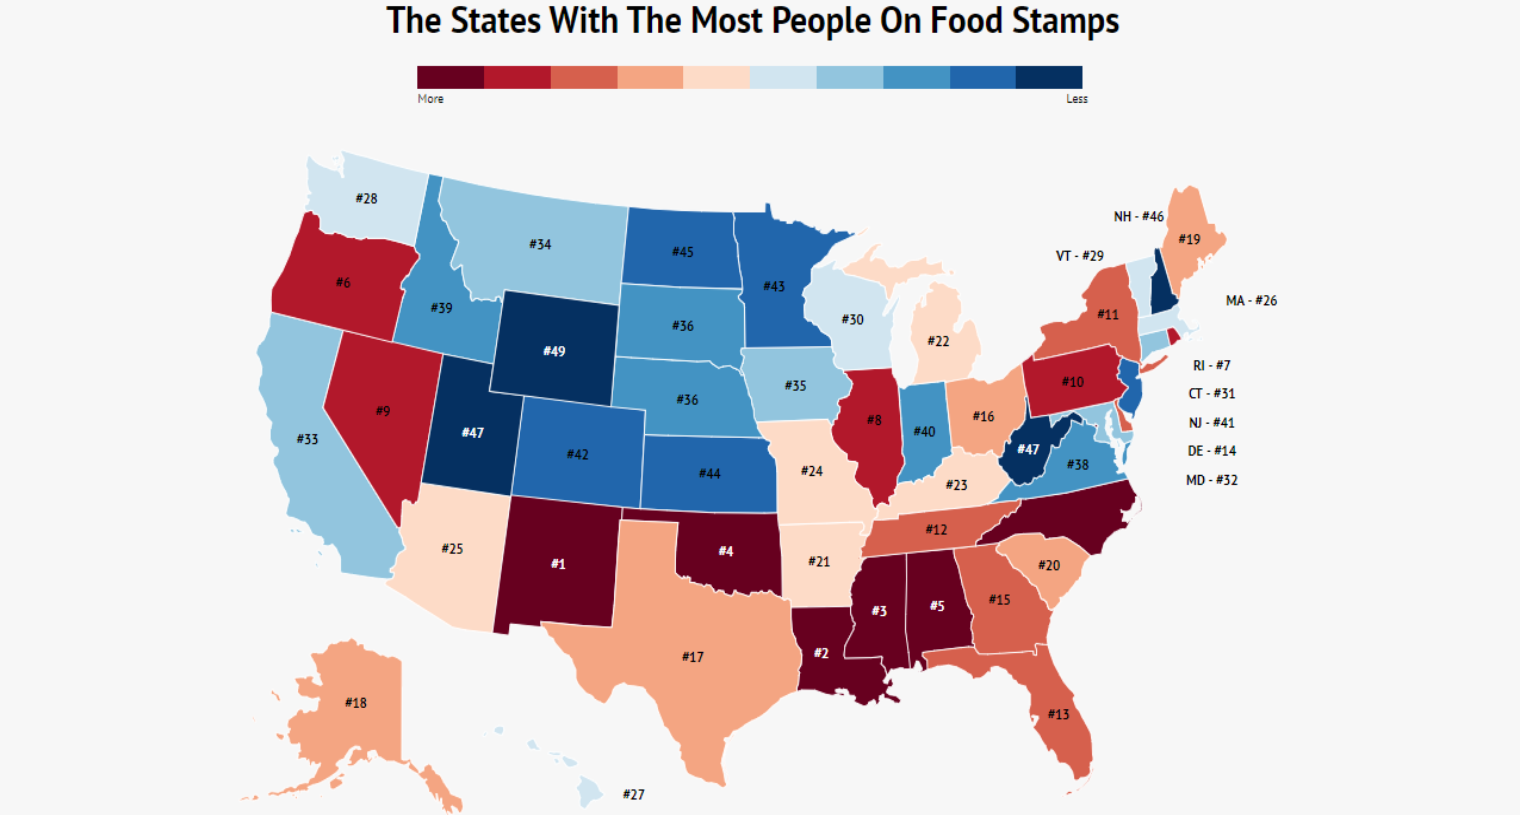
New Mexico has the highest percent of food stamp recipients at 21.49%.
California has the highest amount of food stamp recipients at 3,987,751.
Only 5.54% of people in Wyoming receive food stamps, less than any other state in the US.
26,697,330 Americans receive food stamps (12.4% of the population).
Food stamps have been a heated topic in the political debate recently- with proposed cuts impacting many Americans.
The Supplemental Nutrition Assistance Program (SNAP) is what people mean when they say food stamps. SNAP helps feed millions of Americans, many of whom are children, the elderly, or the disabled. We break down the number of food stamp recipients for each state and the total amount redeemed yearly. However, first here are the highlights of our findings:
All 50 States Ranked From Most People On Food Stamps To Least
| State | % Of The Population | Food Stamp Recipients | Food Stamps Redeemed |
|---|---|---|---|
| New Mexico | 21.49% | 450,221 | $619,024,531 |
| Louisiana | 17.20% | 801,655 | $1,295,018,497 |
| Mississippi | 14.96% | 446,880 | $713,135,677 |
| Oklahoma | 14.79% | 583,042 | $811,995,101 |
| Alabama | 14.76% | 721,299 | $1,083,457,368 |
| Oregon | 14.09% | 590,317 | $882,733,411 |
| Rhode Island | 14.01% | 148,087 | $233,917,388 |
| Illinois | 14.00% | 1,783,530 | $2,700,949,186 |
| Nevada | 13.89% | 421,481 | $628,193,743 |
| Pennsylvania | 13.71% | 1,755,663 | $2,568,454,573 |
| New York | 13.30% | 2,598,826 | $4,448,544,794 |
| Tennessee | 13.06% | 884,025 | $1,397,253,906 |
| Florida | 13.01% | 2,770,280 | $5,777,187,686 |
| Delaware | 12.95% | 125,239 | $202,051,329 |
| Georgia | 12.44% | 1,308,264 | $2,362,433,700 |
| Ohio | 11.77% | 1,375,316 | $2,065,801,626 |
| Texas | 11.76% | 3,376,727 | $5,836,428,708 |
| Alaska | 11.69% | 86,185 | $186,671,667 |
| Maine | 11.66% | 156,079 | $215,608,124 |
| South Carolina | 11.61% | 590,285 | $964,232,162 |
| Arkansas | 11.60% | 349,592 | $494,403,051 |
| Michigan | 11.56% | 1,155,683 | $1,900,615,478 |
| Kentucky | 11.54% | 515,693 | $879,799,216 |
| Missouri | 11.16% | 683,574 | $1,066,784,954 |
| Arizona | 11.12% | 797,795 | $1,207,835,668 |
| Massachusetts | 11.05% | 762,684 | $1,161,235,795 |
| Hawaii | 10.89% | 154,642 | $463,723,986 |
| Washington | 10.75% | 810,037 | $1,259,258,321 |
| Vermont | 10.73% | 67,195 | $69,950,197 |
| Wisconsin | 10.49% | 610,078 | $819,942,881 |
| Connecticut | 10.21% | 364,704 | $614,018,043 |
| Maryland | 10.18% | 615,096 | $984,423,733 |
| California | 10.08% | 3,987,751 | $6,362,195,203 |
| Montana | 9.99% | 106,146 | $157,065,208 |
| Iowa | 9.90% | 312,501 | $451,137,429 |
| South Dakota | 9.08% | 80,139 | $125,887,546 |
| Nebraska | 8.23% | 158,755 | $234,040,337 |
| Virginia | 8.22% | 699,837 | $1,087,408,917 |
| Idaho | 8.17% | 143,236 | $206,827,509 |
| Indiana | 7.78% | 520,463 | $909,202,585 |
| New Jersey | 7.75% | 690,789 | $1,070,141,160 |
| Colorado | 7.74% | 440,612 | $672,250,442 |
| Minnesota | 7.20% | 404,212 | $514,410,616 |
| Kansas | 6.86% | 199,622 | $301,508,197 |
| North Dakota | 6.32% | 48,043 | $82,623,600 |
| New Hampshire | 5.44% | 73,775 | $134,546,170 |
| Utah | 5.34% | 168,772 | $256,424,261 |
| West Virginia | 5.26% | 305,640 | $416,581,435 |
| Wyoming | 4.39% | 25,349 | $42,410,177 |
How We Determined The States That Receive The Most Food Stamps
This one was pretty easy. To determine which state is most reliant on food stamps, we needed to determine the percent of the population on food stamps. We got the state population from the American Community Survey. We then used the USDA’s SNAP data tables to get the number of participants from each state. The higher the percentage of the population receiving food stamps, the higher the state ranked. For example, New Mexico with a staggering 21% of the state receiving food stamps, received a #1, as the state with the highest percent of the population receiving food stamps.
To get an idea of what this aid look like at an economic level, we got the SNAP redemption numbers for each state from the USDA’s SNAP data tables. Unfortunately, our data is missing North Carolina, as they did not report to the USDA.
Keep in mind while you look at the top 10 most dependent states, that the least dependent states have rates below 10%. The states that made the top 10 have staggeringly high levels of food stamp recipients in comparison.
Other Interesting Facts
-
Households must earn less than 130% of the poverty level to receive SNAP
-
A family of four would need to make $31,980 or less to receive SNAP benefits
-
The average household receives $256 a month to spend on food
1.New Mexico
Percent Of Population On Food Stamps: 21.49%
People Receiving Food Stamps: 450,221
Dollar Amount Spent: $619,024,531
With a statewide unemployment of 4.8%, it is no surprise that many New Mexicans rely on food stamps to fill their fridge. With 21% of the population receiving SNAP, almost 1-in-4 residents get some of their food from SNAP. Any changes made to food stamps will likely be felt the most severely in New Mexico.
2.Louisiana

Percent Of Population On Food Stamps: 17.20%
People Receiving Food Stamps: 801,655
Dollar Amount Spent: $1,295,018,497
While 4% less of Louisians receive SNAP benefits than New Mexicans, 17% is still a staggeringly high number. Louisiana also ranked as one of the worst states for millennials due to its high poverty rate and unemployment.
3.Mississippi

Percent Of Population On Food Stamps: 14.96%
People Receiving Food Stamps: 446,880
Dollar Amount Spent: $713,135,677
Deep in the south, we have our #3. Mississippians are third most likely to be on food stamps. It is a similar story to Louisiana- with high poverty rates and unemployment that mean many need SNAP to help make ends meet.
4.Oklahoma
Percent Of Population On Food Stamps: 14.79%
People Receiving Food Stamps:583,042
Dollar Amount Spent: $811,995,101
14% of Okies receive food stamps. While they are a decent bit lower than New Mexico, this rate still has them severely dependent on food stamps.
5.Alabama

Percent Of Population On Food Stamps: 14.76%
People Receiving Food Stamps: 721,299
Dollar Amount Spent: $1,083,457,368
At #5, Alabama is the second southern state in the top 10. 14.76% of Alabamians rely on food stamps to help feed their families.
6.Oregon

Percent Of Population On Food Stamps: 14.09%
People Receiving Food Stamps: 590,317
Dollar Amount Spent: $882,733,411
The Beaver state is the 6th most food stamp reliant state in the nation. 14% of Oregon residents receive food stamps.
7.Rhode Island
Percent Of Population On Food Stamps: 14.01%
People Receiving Food Stamps: 148,087
Dollar Amount Spent: $233,917,388
Rhode Island is known for having a strong middle class. However, a significant chunk of the population still relies on food stamps.
8.Illinois
Percent Of Population On Food Stamps: 14.00%
People Receiving Food Stamps: 1,783,530
Dollar Amount Spent: $2,700,949,186
Illinois has the highest dollar amount of redeemed food stamps in the top 10 at $2,700,949,186. Of course, Illinois has the highest overall number of food stamp recipients on the top 10, so that isn’t particularly surprising.
9.Nevada
Percent Of Population On Food Stamps: 13.89%
People Receiving Food Stamps: 421,481
Dollar Amount Spent: $628,193,743
The Silver State came in at #9. Almost 14% of residents receive food stamps to keep them from food insecurity.
10. Pennsylvania
Percent Of Population On Food Stamps: 13.71%
People Receiving Food Stamps: 1,755,663
Dollar Amount Spent: $2,568,454,573
13.7% of Pennsylvanians receive food stamps to help them get by. While this is 7% lower than New Mexico at #1, it is still a far mark off from other states.
Summary On The 10 States That Receive The Most Food Stamps
There you have it, the 10 states that receive the most food stamps. From New Mexico to Pennsylvania, these states have a higher percent of residents receiving food stamps than any other. These states are likely to feel any change to federal SNAP policy the most severely.
There are a few takeaways to keep in mind. Food stamps are based on a federal poverty level, while cost of living can vary dramatically from state-to-state and even within a state itself. This means that struggling residents in low costs of living areas are more likely to receive needed food assistance than in higher cost of living areas.
Another factor to take into consideration is that food stamps while food stamps are federally funded, they are administered at a local level and some states are more effective at distributing benefits than others.
Author
Kathy is the head of content at Zippia with a knack for engaging audiences. Prior to joining Zippia, Kathy worked at Gateway Blend growing audiences across diverse brands. She graduated from Troy University with a degree in Social Science Education.