Review

An Overview of Low-Level Jets (LLJs) and Their Roles in Heavy Rainfall over the Taiwan Area during the Early Summer Rainy Season

1
Department of Atmospheric Sciences, University of Hawaii at Mānoa, Honolulu, HI 96822, USA
2
Department of Atmospheric Sciences, National Central University, Zhongli District, Taoyuan City 320317, Taiwan
3
Department of Atmospheric Sciences, National Taiwan University, Taipei 10617, Taiwan
*
Author to whom correspondence should be addressed.
Meteorology 2022, 1(1), 64-112; https://doi.org/10.3390/meteorology1010006
Submission received: 25 January 2022 / Revised: 23 February 2022 / Accepted: 26 February 2022 / Published: 17 March 2022

Abstract

:
During the early summer rainy season over Taiwan, three types of low-level jets are observed, including a synoptic low-level jet (SLLJ) situated in the 850–700 hPa layer in the frontal zone, a marine boundary layer jet (MBLJ) embedded within the southwesterly monsoon flow over the northern South China Sea at approximately the 925 hPa level, and an orographically induced jet at approximately the 1 km level off the northwestern Taiwan coast (e.g., barrier jet (BJ)). The characteristics and physical processes of the formation of these three types of low-level jets are reviewed, and their roles in the development of heavy rainfall are discussed.

1. Introduction

Over East Asia, the Asian summer monsoon is one of the most dominant climate systems on earth and it can bring frequent heavy rainfall periods to the affected region. The summer monsoon rainy season from early June through July is known as the Baiu season in Japan [1], Changma season in Korea [2], and Mei-Yu season in China [3]. Taiwan has an early summer rainy season under the southwesterly monsoon flow (Mei-Yu) from mid-May to mid-June and the typhoon season from late June to September [4,5,6,7,8]. Heavy rainfall events are one of the extreme weather phenomena that pose a significant challenge for both scientific research and operational forecasts. These events share two essential characteristics globally: copious moisture and destabilization effects due to lifting, e.g., [3,9,10,11,12,13,14,15,16,17,18,19,20,21,22].
There are different types of “low-level jets” (LLJs) around the globe [23], such as in Europe [24,25,26], the Alps [11,17], East Asia [15,27,28,29,30,31,32,33,34,35,36,37,38], the Caribbean [39,40], the U.S East coast [41], the Carolina coast [42], the California Coast [43], the Pacific Northwest [14,44], the Great Plains states [45,46,47,48,49], and subtropical South America [50,51,52]. In some cases, LLJs may play important roles in moisture transport and/or lifting, leading to heavy precipitation events.
G. Chen and Yu [28] used horizontal wind speed greater than 12.5 m s−1 at the 850 hPa level and greater than 15 m s−1 at the 700 hPa level to identify the LLJs from weather maps. Tao and Chen [3] also classified LLJs using wind speed at the 925 hPa, 850 hPa, and 700 hPa levels. In addition to horizontal wind speed, both Chen et al. [32] and Du et al. [53,54] included vertical wind shear in their LLJ criteria, using high resolution data from numerical models. Du et al. [53] used two criteria to identify LLJs: a wind speed maximum greater than 10 m s−1 in the lowest 4 km and a decrease in winds with height, by at least 3 m s−1, above the level of maximum winds. Du et al. [53] classified LLJs during the Mei-Yu season over China into two types: synoptic-system-related low-level jets (SLLJs) in the 900–600 hPa layer and boundary layer jets (BLJs) below the 900 hPa level. Over the southern China coast, SLLJs occur most frequently in April–June, whereas BLJs are more frequent in May–July [55]. During BLJ events, rainfall has a local maximum on the southern windward side of the coastal mountain ranges caused by orographic lifting (see Figure 7 in [55]). However, rainfall has a local maximum on the coast and in inland areas during SLLJ events due to horizontal moisture transport by SLLJs.
During the early summer rainy season over Taiwan, there are three distinct types of low-level jets: the SLLJ located southeast of an 850–700 hPa Mei-Yu frontal cyclone along the large-scale Mei-Yu trough [28,31,32,33,56,57]; the marine boundary layer jet (MBLJ) associated with intensification of the southwesterly monsoon flow in the marine boundary layer (MBL) over the northern South China Sea [58,59,60]; and the barrier jet (BJ) of approximately 14 m s−1 at the 1-km level, blowing parallel to the coastal terrain along the northwestern Taiwan coast [61,62,63,64,65]. This study will review and discuss the roles these three low-level jets have in heavy rainfall occurrences over the Taiwan area, as well as their convective feedback effects.
In Section 2, a brief review of the structure of Mei-Yu fronts and the associated thermally direct secondary circulation driven by a moist baroclinic process is given. We show that the SLLJs and upper-level jets (ULJs) are integral parts of the thermally direct secondary circulation. The importance of the coupling between the upper-level dynamic forcing and low-level baroclinic forcing in the development of heavy rainfall is presented. We also discuss the impacts of latent heat release on baroclinic conversion and cyclogenesis along the Mei-Yu front. In addition to frontal lifting, we discuss rainfall production by orographic effects over southwestern Taiwan. Climatologically, when the southwesterly monsoon is well established in June, rainfall is at a maximum on the windward sides of the Snow Mountains and the Central Mountain Range (CMR) [66]. In 
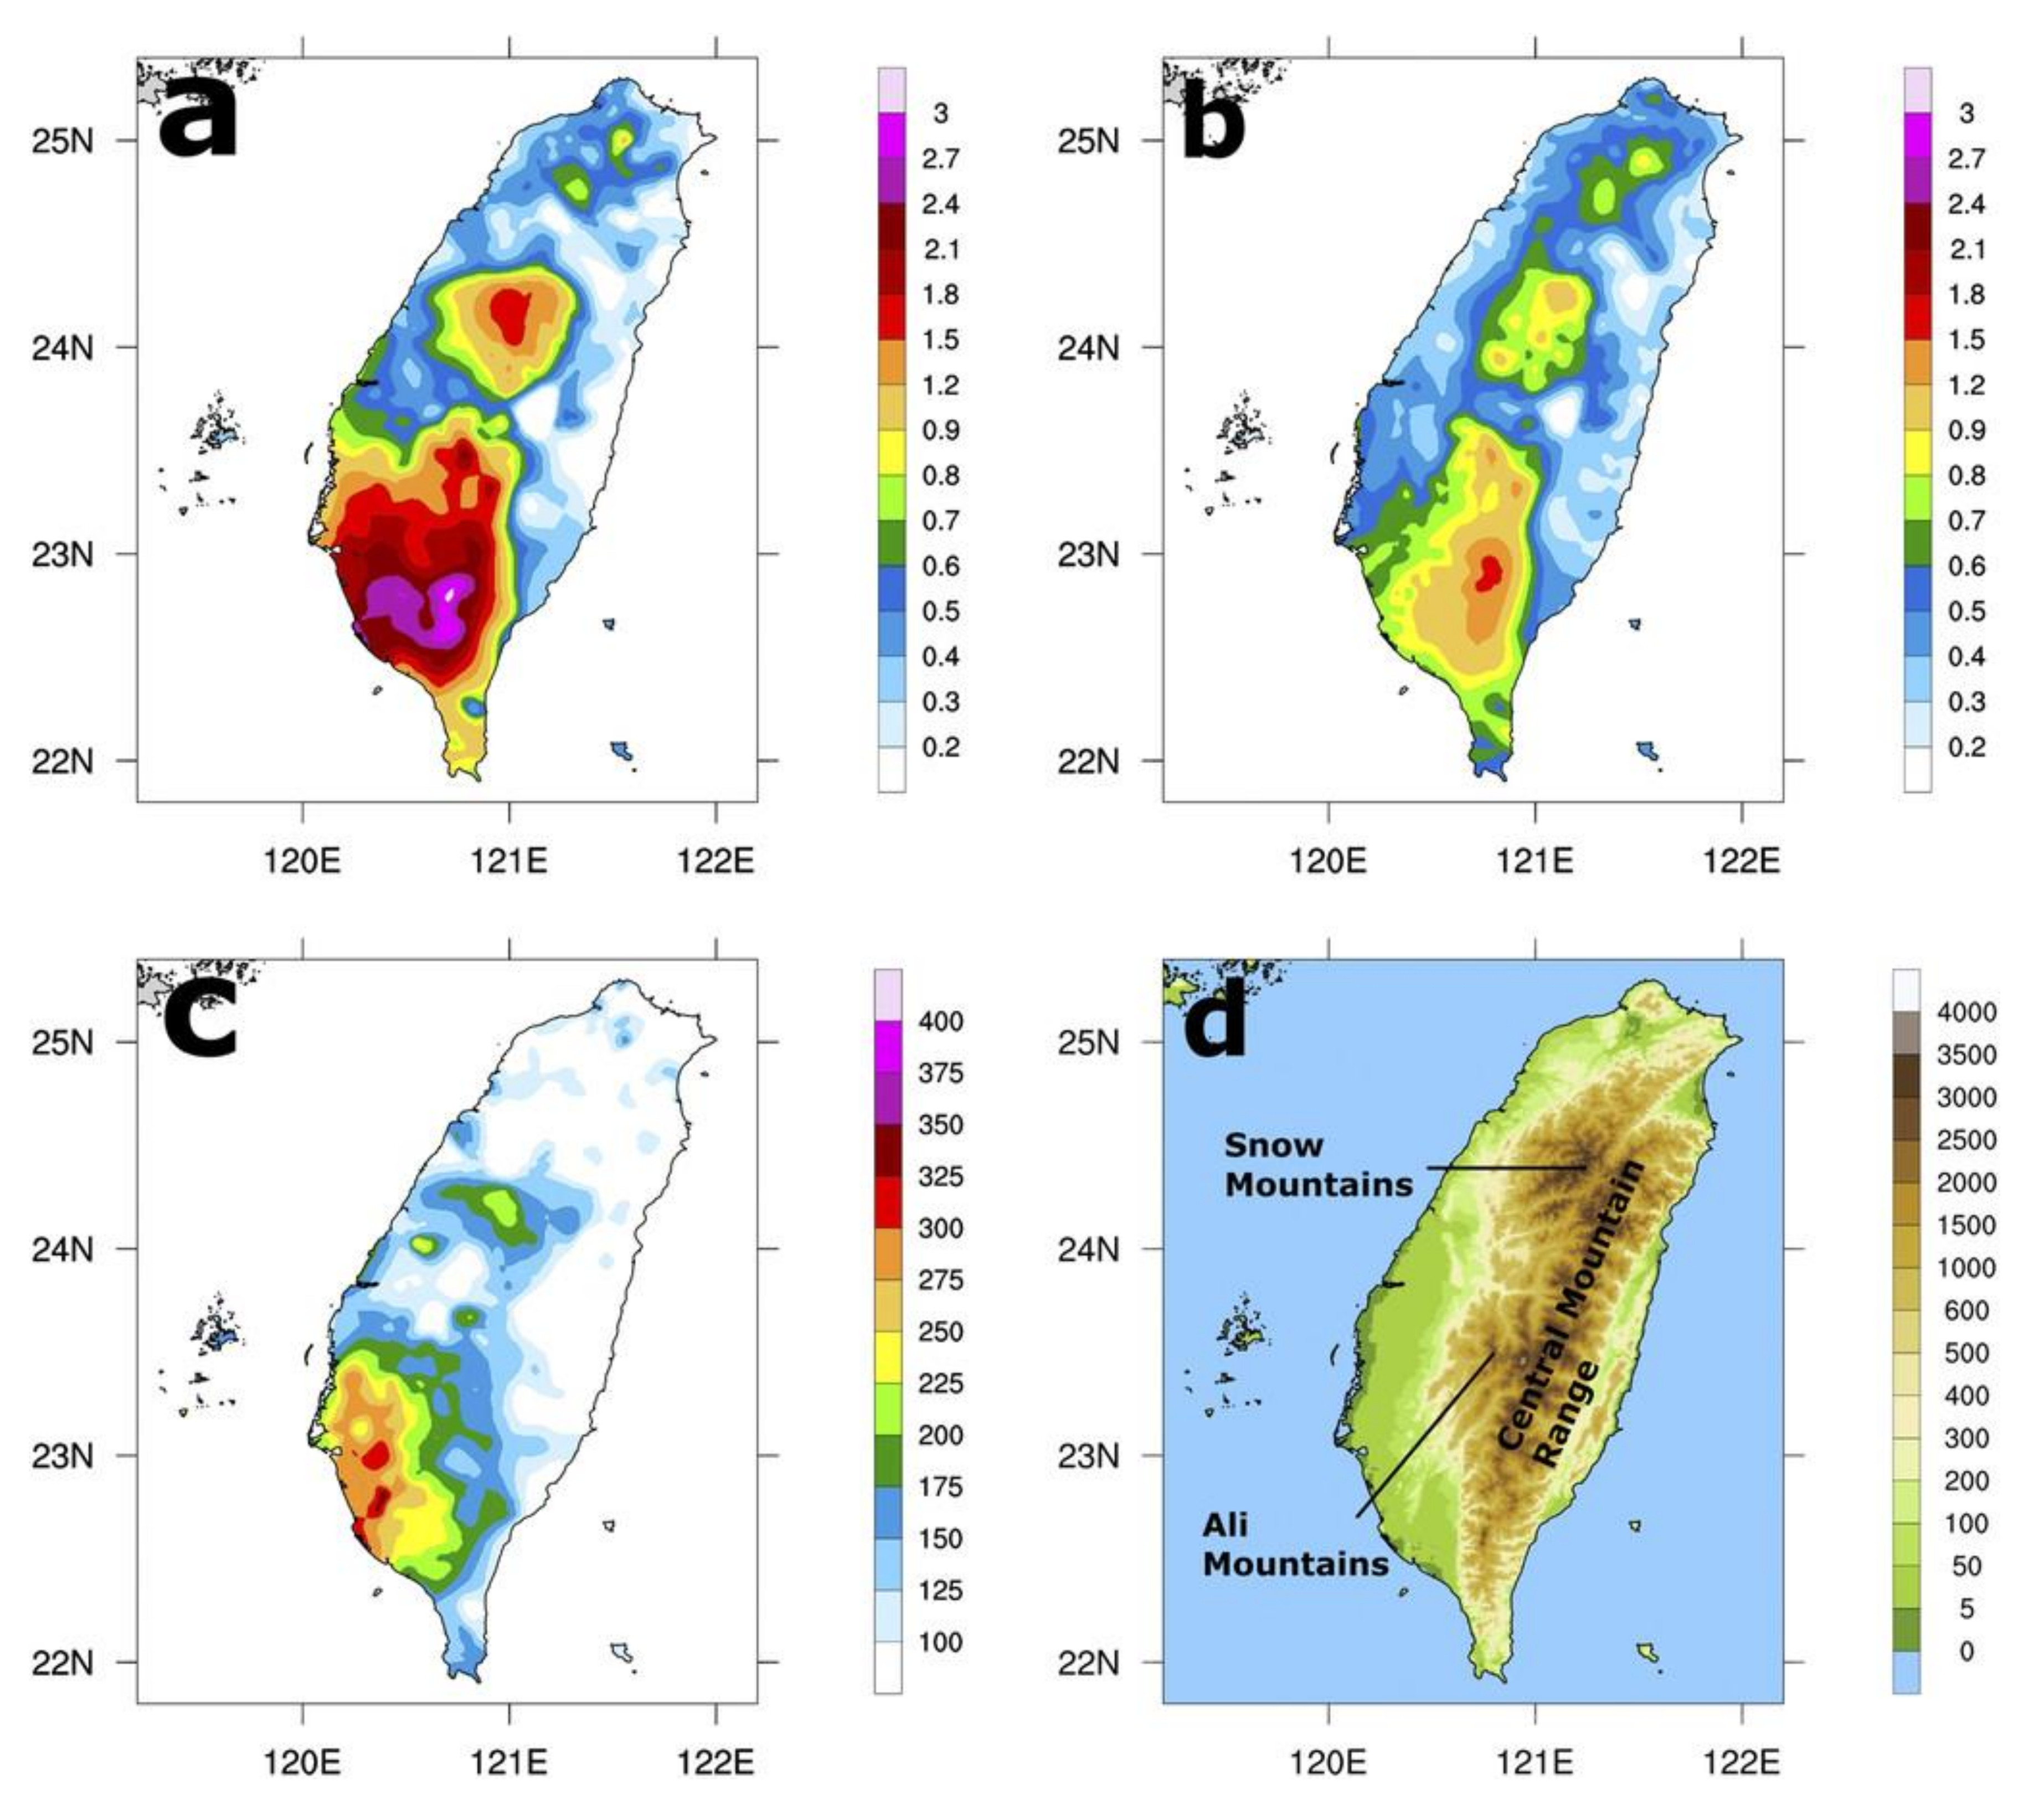
Section 3, the general characteristics of MBLJs, their role in the production of heavy rainfall, and their convective feedback are presented. When a MBLJ is present, with strong winds in the lowest 1 km, rainfall distributions frequently have a pronounced maximum over southwestern Taiwan, especially along the coast (Figure 1). In Section 4, the dynamics, structure, and role of the barrier jet on moisture transport and the production of localized heavy rainfall over the western/northwestern coast are discussed. In Section 5, the interactions among the three types of LLJs on heavy rainfall over Taiwan is presented and a summary is provided in Section 6.

2. The SLLJs Associated with Mei-Yu Fronts

The Taiwan Area Mesoscale Experiment (TAMEX) during May–June 1987 [67] and the Terrain-influenced Monsoon Rainfall Experiment (TiMREX) during May–June 2008 [68,69,70,71] were conducted to study the processes leading to heavy rainfall during the early summer rainy season in Taiwan. During TAMEX, all the Mei-Yu fronts over southern China resemble mid-latitude cold fronts with horizontal temperature differences of approximately 5–7 K in the lowest levels, and a marked northward vertical tilt [5,72,73,74,75] (Figure 2). An ULJ and tropopause folding associated with the upper-level front are also evident. During the passage of a midlatitude trough, the cold air behind the trough from northern China moves into the south China plain [5,72,73,75] (Figure 3). As a result, the surface front over southern China advances southeastward and moves across the Taiwan area. During the last TAMEX frontal event affecting Taiwan during 24–25 June 1987, the low-level horizontal temperature differences (Figure 3) and baroclinic characteristics were less significant, as compared to other cases earlier in the season. This is the result of increased warming over the North China Plain with increased solar heating during the seasonal change in mid-June [75].
A TiMREX case during the Intensive Observing Period (IOP) #3 from 1200 UTC 29 May to 0600 UTC 30 May 2008 [70] and a case on 3 June 1984 [76], as well as in other recent studies [60,77] all confirm these Mei-Yu frontal systems possess baroclinic characteristics.
As the Mei-Yu jet/front system moves toward the subtropics, the depth of the postfrontal cold air decreases to a rather shallow depth of ~1 km over the Taiwan area [5,72,73,74] in response to a smaller Coriolis parameter. At the leading edge, the fine-scale structure of the shallow front in the lowest levels resembles a density current, as observed by an instrumented aircraft (Figure 4).
During the 1980–1984 Mei-Yu season, G. Chen and Yu [28] observed that 12 h before the commencement of a heavy rainfall event over northern Taiwan, there is an 84% chance that a SLLJ of at least 12.5 m s−1 is present at the 700 hPa level. Similarly, when a SLLJ greater than 12.5 m s−1 is present at the 700 hPa level, there is a 91% probability that a heavy precipitation event, greater than 100 mm day−1, will occur over northern Taiwan. They suggested that the SLLJ is driven by convective heating [28,31,78,79] and that the SLLJ is responsible for the transport of warm, moist air to the prefrontal atmosphere of the Mei-Yu frontal zone [4].
TAMEX and recent studies have showed that SLLJs in the warm sector of Mei-Yu fronts are caused by a mass-momentum adjustment process in response to moist baroclinic forcing during the deepening of a Mei-Yu jet/front system [32,33,80]. Each Mei-Yu front affecting Taiwan during TAMEX was accompanied by a SLLJ of varying intensity [56,63,75]. The frontal cyclone during 1–3 June 1987 (Figure 5) was the deepest cyclone observed during TAMEX [33].
During TAMEX, each SLLJ event began when an upstream mid-latitude trough approached the Tibetan Plateau from the west/northwest with an initial vortex forming on the leeside of the Tibetan Plateau or the Yun-Gui Plateau [56]. As the trough advanced southeastward into the China Plain, the lee vortex developed into a Mei-Yu frontal cyclone with a SLLJ in its southeastern flank (
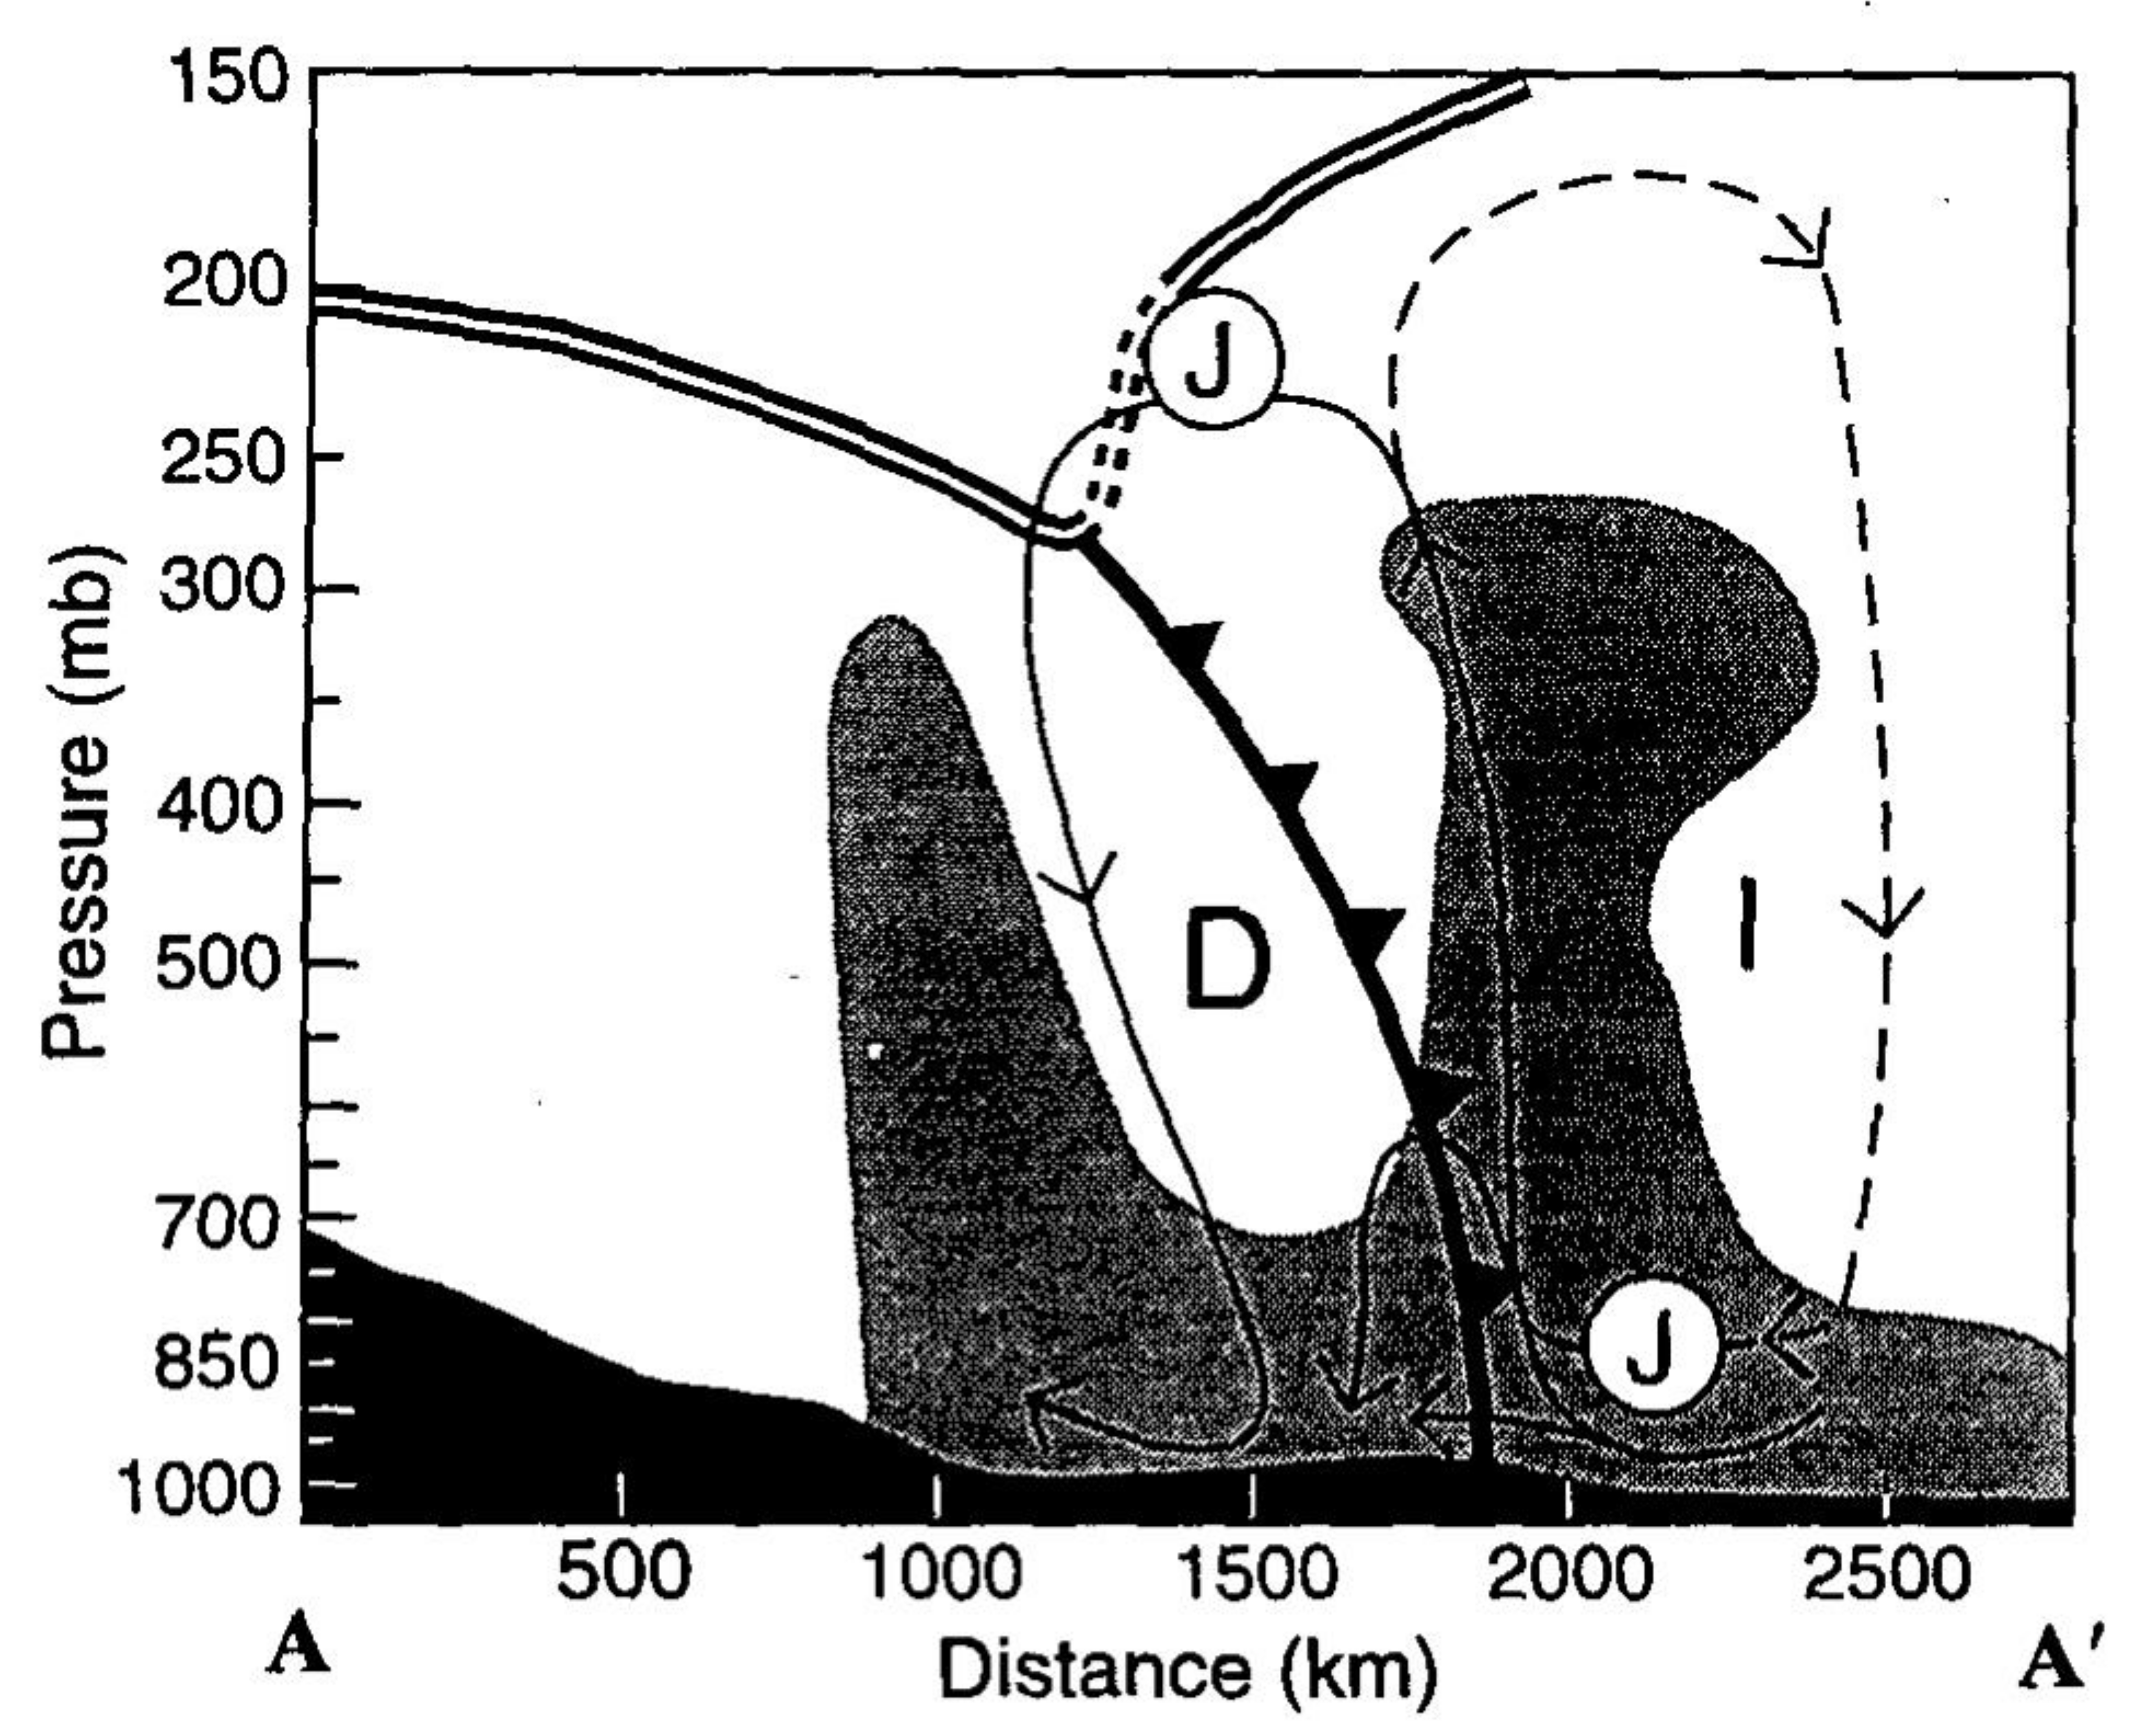
Figure 5). A SULJ/front with tropopause folding was evident in the upper levels. A schematic of the secondary circulation across the Mei-Yu jet/front system is provided in Figure 6 [32]. The intensification of the SLLJ (SULJ) is caused by the cross-isobaric wind component towards the low-pressure center of the frontal cyclone (upper-level tough) as the frontal cyclone deepens. Additionally, a weak thermally indirect circulation to the south is diagnosed.
From calculations of energy conversion of the SLLJ case during 1–3 June 1987, X. Chen and Chen [80] determined that the divergent kinetic energy (kD) is generated from potential energy (PE) through the cross-contour divergent winds. The generated kD is then converted into nondivergent kinetic energy (kND) via a conversion process through the secondary circulation across the jet/front system. In the upper levels, the conversion from potential energy to kND via cross-contour nondivergent winds is the major source for the kND associated with intensification of the SULJ. In this case, the upper-level divergence ahead of the trough provides the upper-level support needed for the SLLJ development.
Model sensitivity tests with (CTRL) and without latent heat release (NOLH) of the 1–2 June 1987 case reveals that tropopause folding is present even without latent heat release [33]. The deepening of the Mei-Yu frontal cyclone is caused by vertical motion associated with the propagating upper-level short-wave trough and is enhanced by latent heat release. The baroclinic conversion is enhanced by latent heat release, especially in the upper troposphere (Figure 7). In the upper levels, the thickness ahead of the trough increases, resulting in further deepening of the cyclone. The SLLJ develops through the Coriolis force acting on the cross-contour ageostrophic winds (Figure 6) in response to the increased pressure gradients as the frontal cyclone deepens. This mechanism is at variance with the conditional instability of the second kind (CISK) process suggested by G. Chen and Chang [81] and Chou et al. [78].
In the 29–30 May 2008 case, Tu et al. (see Figure 4 in [70]) simulated a low-level frontal cyclone along the southeastern China coast as the 700 hPa short-wave trough moves over the low-level moist tongue. In the regional domain with a 27 km grid, quasi-geostrophic (QG) frontogenesis is diagnosed ahead of the 700 hPa trough axis without latent heat release in the model. In the nested 9 km grid, the latent heat release associated with the convective activity generates significant potential vorticity (PV) at low levels, leading to a more intense frontal cyclone and a stronger SLLJ.
Numerical simulations with a 9 km grid for the 1–2 June 2017 case (see Figure 10 in [60]) reproduces a Mei-Yu frontal structure that is similar to the results analyzed by TAMEX studies (Figure 2 and Figure 6). The potential vorticity associated with the Mei-Yu frontal zone slopes vertically northward. A potential vorticity maximum generated by upright cumulus convection extends vertically upward above the surface front. The spin up of the frontal cyclone is caused by a moist baroclinic process. These results are consistent with previous studies [32,33] and the study presented by Park et al. [38] for heavy rainfall events during the Changma season over the Korean Peninsula. Park et al. [38] determined that the baroclinic trough from the west plays an important role in triggering vertical motion and the development of a surface cyclone with a SLLJ on the southeastern flank of the cyclone. Using the QG omega equation, they demonstrated that in the developing stage of heavy rainfall events, both the dynamic forcing and diabatic forcing are equally important. However, the effects of latent heating are more important in the mature stage.
From the calculations of heat and moisture budgets for a heavy rainfall case over the south China coast during 20–23 May 1987 (see Figure 20 in [61]), it is apparent that the tendency and horizontal advection terms are considerably smaller than the vertical advection terms, suggesting that vertical motion is the dominant mechanism in the production of heavy rainfall. There are two heavy rainfall periods centered around 0000–1200 UTC 20 May and 0000–1200 UTC 22 May with rainfall accumulation greater than 50 mm and 150 mm, respectively. During 20–22 May, positive vorticity advection by thermal winds is diagnosed ahead of the deepening 850 hPa trough [61]. Prior to the first peak rainfall period on 20 May, upper-level divergence is computed in the diffluent airflow at the 300 hPa level between the upper-level westerlies and the northeastern flank of the upper-level Asian cyclone. A similar large-scale environment is also found with the heavy rainfall case during 24–25 June 1987 [62]. In the second period on 22 May, strong upper-level frontogenesis due to horizontal deformation is diagnosed along the trough axis. The heaviest rainfall occurs when the low-level baroclinic forcing is coupled with the upper level forcing as the upper-level trough approaches. Park et al. [38] found that the heavy rainfall events in South Korea during the summer monsoon are organized by the vertical motions associated with a baroclinic trough with positive feedback from latent heating. The thermally direct secondary circulation at the entrance region of the SULJ provides additional upper level forcing aloft.
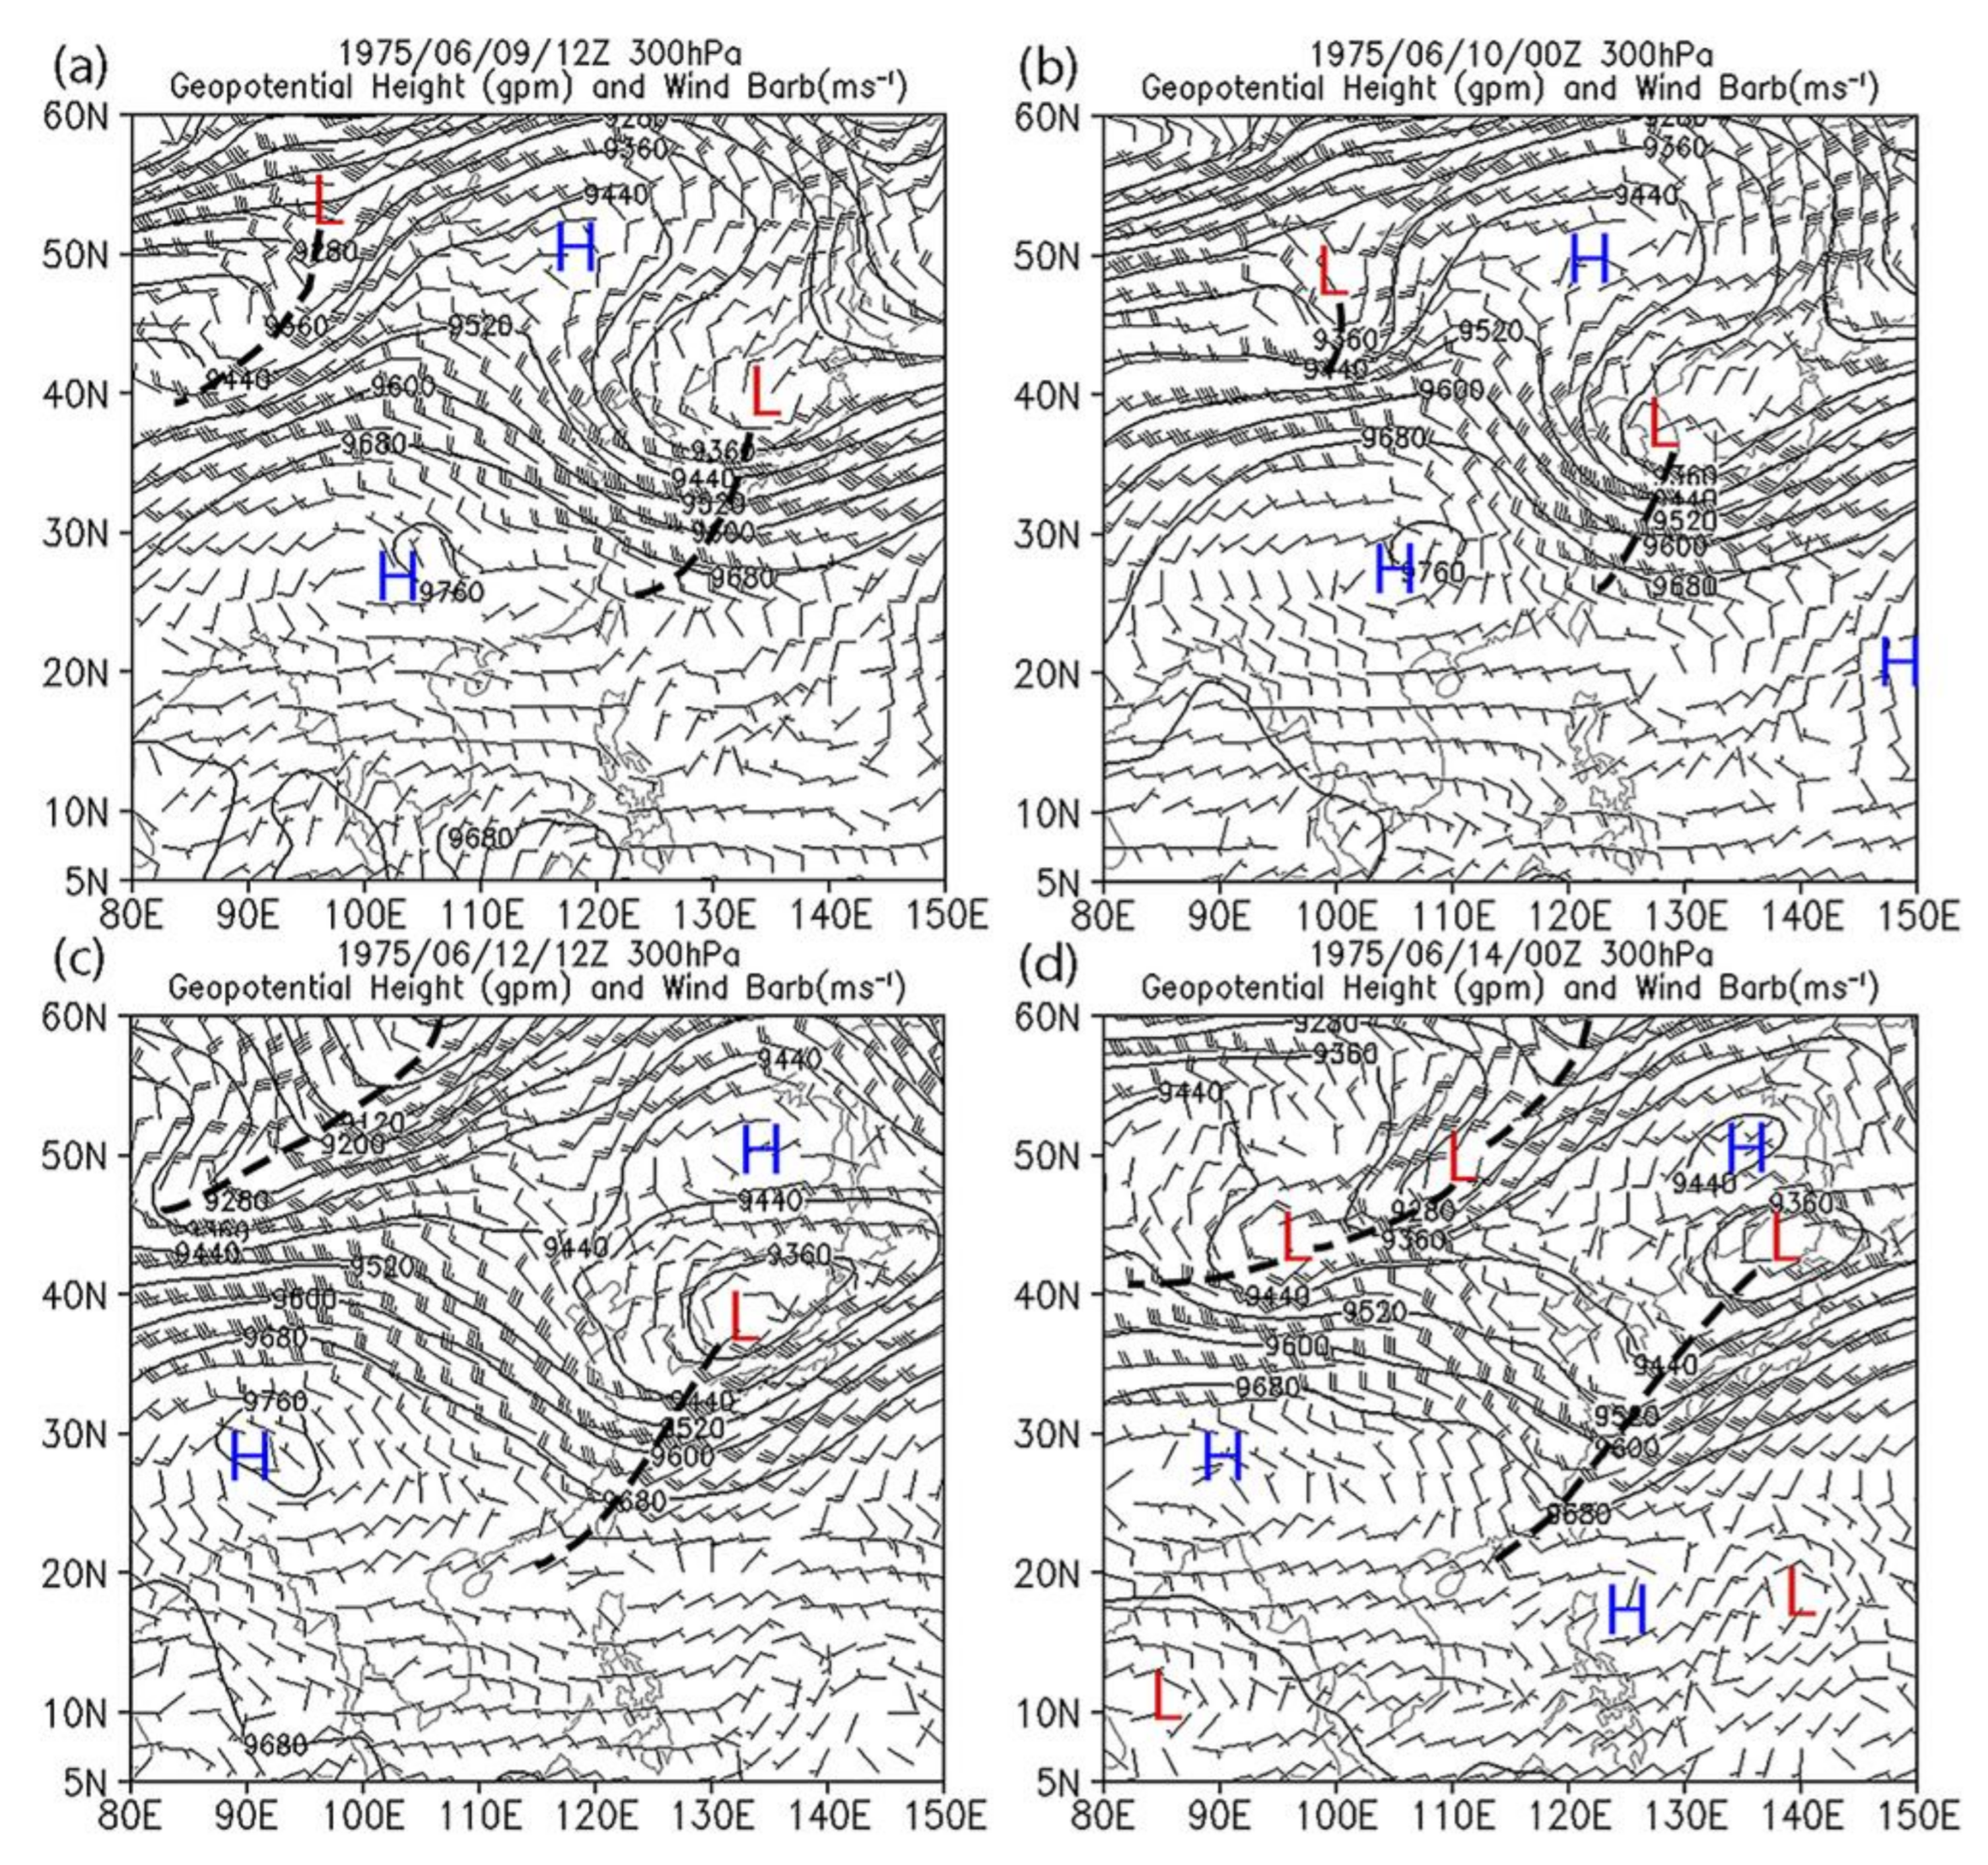
Hsiao and Chen [82] revisited the 10–15 June 1975 case studied by G. Chen and Chang [81] using the European Centre for Medium-Range Weather Forecast (ECMWF) Reanalysis (ERA-40) data with 23 vertical levels. In this case, a mid-latitude omega blocking pattern in place on 10 June had developed into a Rex blocking pattern by 12 June (
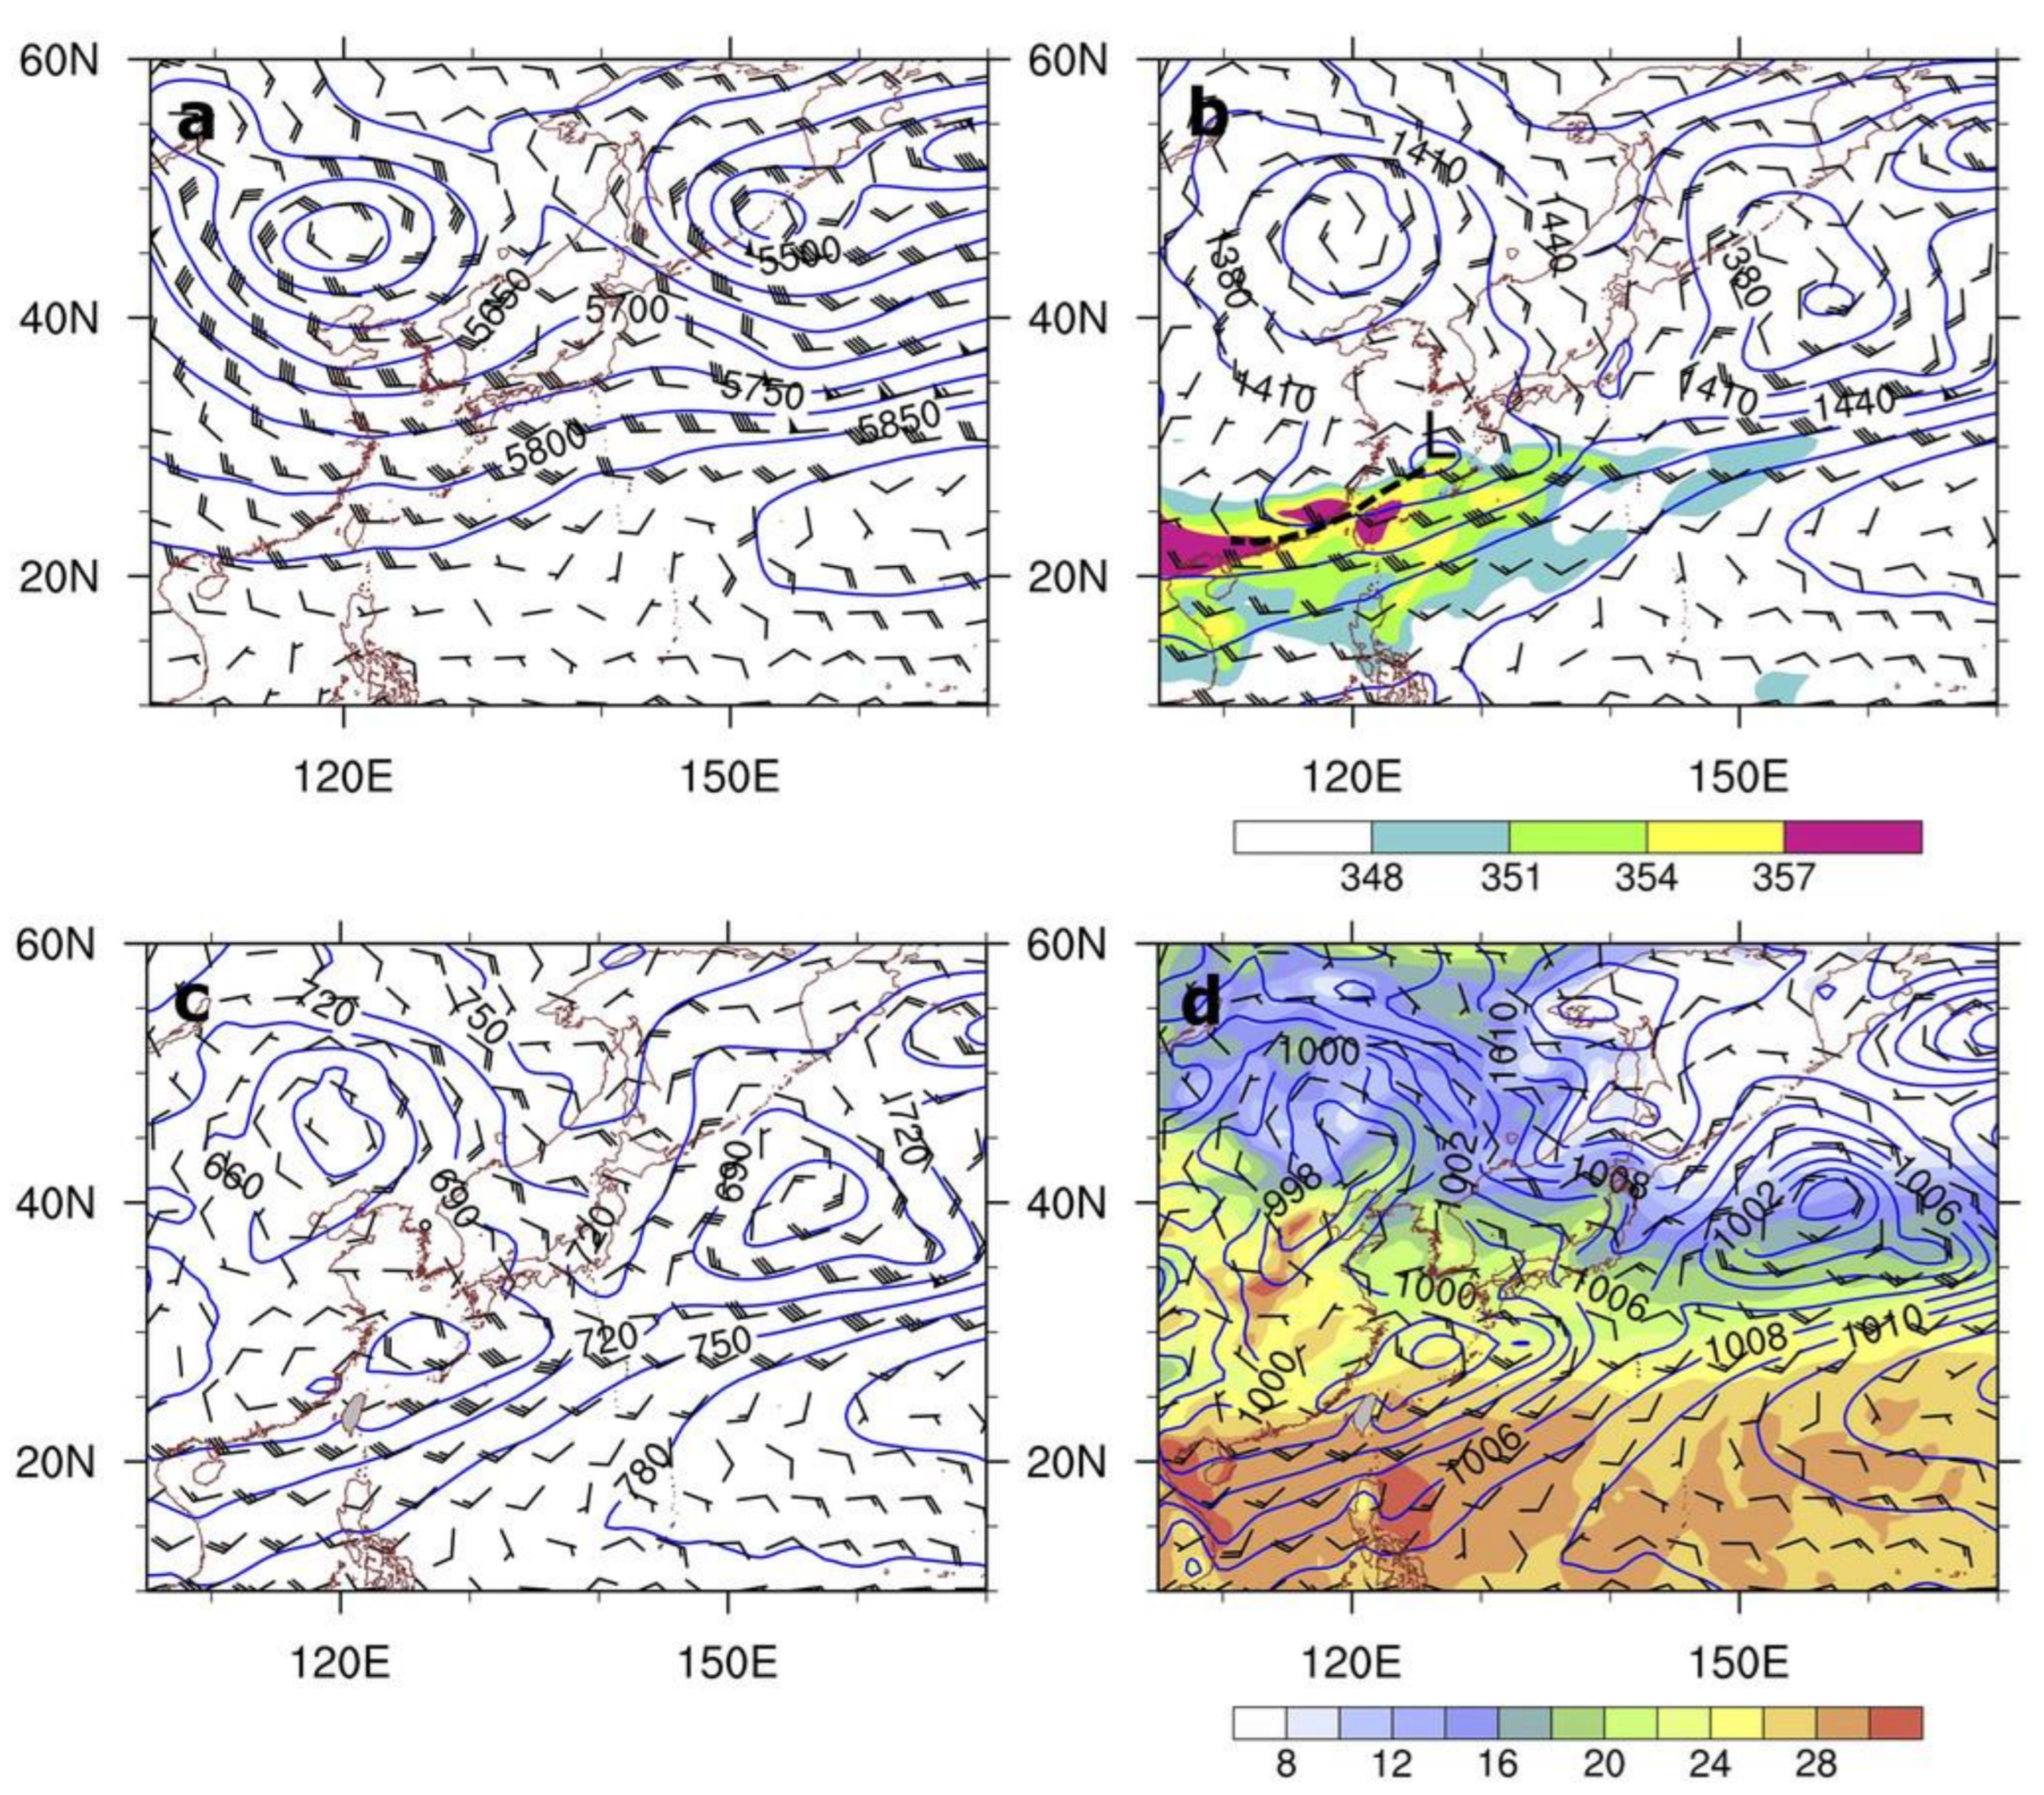
Figure 8). A trough axis extends from a low associated with the block. The surface front over south China moved slowly southward (Figure 9) and affected the Taiwan area for more than four days. In the low levels, prefrontal warm, moist southwesterly flow converged with postfrontal cold, dry northwesterly flow. At the 500 hPa level, a high equivalent potential temperature axis was present, which coincided with the area of rising motion (Figure 9b) in the baroclinic zone (Figure 9c). The high equivalent potential temperature air in the mid-levels was brought vertically upward from low levels by the rising motions in the baroclinic zone. In the upper levels, an upper-level front with tropopause folding was also present (not shown). The SULJ and the upper-level front advanced southward (Figure 9d). The frontal structure and characteristics are remarkably similar to those found during TAMEX and in recent studies (Figure 2 and Figure 6). Note that in the composite analysis presented by G. Chen and Chang [81] for the same case, the appreciable temperature gradients across the surface front in the low levels and the baroclinic signatures in the upper levels are completely absent when using the filtered and subjectively analyzed 240 km grid data and composite procedures that used data based on only four vertical levels (e.g., 850 hPa, 700 hPa, 500 hPa, and 400 hPa levels).

3. The Marine Boundary Layer Jet

Using the 9 km WRF model data, Du et al. [54] found the existence of a coastal boundary layer jet (CBLJ) with wind speed greater than 8 m s−1 and a jet core at approximately the 925 hPa level off the eastern coast of China (around 28° N, 120° E) along the western periphery of the west Pacific subtropical high (WPSH). This CBLJ occurs in the wake of the northward migration of the Mei-Yu rain belt to the Yangtze River Valley in July. Geostrophic winds account for 87% of the total winds of the CBLJ. The CBLJ is influenced by terrain and thermal effects during the diurnal cycle with a nocturnal maximum before sunrise.
Chen et al. [77] studied a heavy rainfall event during 10–12 June 2012 over the windward slopes of the Snow Mountains and the Central Mountain Range. The rainfall accumulation of this three-day event was more than 1500 mm (Figure 10). With the presence of a midlatitude omega-blocking pattern (Figure 11a), a persistent cold northerly wind component west of the northeast China low and west of the Mei-Yu frontal cyclone extends all the way to the subtropics up to the 700 hPa level (Figure 11b,c). At the 850 hPa level, a west-southwesterly SLLJ (Figure 11b) is present with a maximum equivalent potential temperature axis associated with the Mei-Yu front. The vertical cross-section along 119.5° E shows that the Mei-Yu front is characterized by a marked vertical tilt and an SULJ at the 250 hPa level (Figure 12a). The prefrontal warm, moist southwesterly flow is lifted by the secondary circulation in the frontal zone, as evidenced by a warm, moist tongue above the sloping frontal zone. The characteristics of the Mei-Yu jet/front system (Figure 12) resemble those found in TAMEX studies (Figure 2). The most striking feature is a strong low-level jet area at the 950 hPa level with associated horizontal moisture fluxes of more than 360 g kg−1 m s−1 from the northern South China Sea to Taiwan (Figure 12b). This feature is referred to as the Marine Boundary Jet (MBLJ) in Tu et al. [58]. In the 10–12 June 2012 case, the SLLJ and MBLJ coexisted [77]. A similar situation is also reported over southern China during the early summer rainy season [37,55,83,84,85,86]. Statistically, warm-sector rainfall over the southern China coastal areas has an early morning maximum caused by the interaction between the MBLJs and the land breeze. The SLLJs are more closely associated with frontal heavy rainfall [86].
Tu et al. [58] used the National Centers for Environmental Prediction (NCEP) Climate Forecast System Reanalysis (CFSR) data with a 0.5° × 0.5° grid, 6 h time intervals, and 37 pressure levels [87] to identify MBLJs during June 2008–2012. Two criteria were used to classify the MBLJs: (1) a maximum wind speed greater than 10 m s−1 below the 900 hPa level; and (2) a decrease in winds speed below 4 km, by at least 3 m s−1, between the height of the maximum wind to the wind minimum aloft. A day (0000–2359 UTC) can be defined as a MBLJ day when more than 60% of the grid points in the black box (Figure 13) satisfy the MBLJ criteria for more than 6 h.
Marine boundary layer jet events are more common in the second half of Taiwan’s early summer rainy season in June, when the southwesterly monsoon flow is well established, than during the monsoon onset phase in May. Note that cases in which either a tropical cyclone (TC) or a tropical depression (TD) is located within 8°–35° N, 105°–150° E over the western Pacific are excluded. There were nine MBLJ events over 21 days during the month of June in the years 2008–2012 (Table 1). The composite map for the MBLJ days shows that the intense southwesterly monsoon flow, with speeds greater than 10 m s−1, covers nearly the entire northern South China Sea and has a jet core of approximately 13 m s−1 just upstream of southwestern Taiwan (Figure 14a). In addition to gravity wave drag, the CFSR model includes a parameterization for mountain blocking [88], following the subgrid-scale orographic drag parameterization [89]. Figure 14a shows low-level flow splitting past the mountainous island due to orographic blocking. The MBLJ is a transient feature related to the subsynoptic pressure gradients between a deep Mei-Yu trough over southeastern China and a strong westward extending WPSH (Figure 14a,b). During MBLJ days, the Mei-Yu trough over southern China is deeper and the WPSH is stronger and extends farther westward (Figure 14c) with larger horizontal pressure gradients over the northern South China Sea, as compared to the June monthly mean (Figure 14b).
The MBLJ over the northern South China Sea is distinctly different from the SLLJ associated with a Mei-Yu jet/front system or the SLLJ associated with a winter cold front that brings heavy rainfall to the US west coast [12,45]. The MBLJ occurs in the subtropics during the summer monsoon and does not require the presence of a frontal system over the Taiwan area [58]. At the 925 hPa level, geostrophic winds make up 90% of the MBLJ (Figure 15a–c). The warm, moist, high equivalent potential temperature air (Figure 15d) and southwesterly horizontal moisture fluxes (Figure 15f) occur mainly below the 1 km level and are easily missed by forecasters using charts only down to the 850 hPa level. With a stably stratified and nearly barotropic atmosphere under the influence of the WPSH over the ocean, the vertical profile of the MBLJ resembles an Ekman spiral (Figure 16) with supergeostrophic winds and a wind speed maximum near the top of the mixed layer.
In contrast to the summer CBLJs [54] and CBLJs in other locations that are affected by orographic effects and/or land surface heating/cooling of the adjacent coastal terrain, the ageostrophic winds associated with the MBLJ points toward lower pressure (e.g., the Mei-Yu trough over southern China) during all four 6 h periods of the diurnal cycle. The MBLJs occur at relatively low latitudes, at approximately 20° N over the open ocean, and are weakest and closest to geostrophic in the late afternoon. Vertical mixing in the MBL during the daytime may cause a reduction in the wind speed maximum in the afternoon hours (Figure 17). The dynamics and diurnal variations of the MBLJ will be investigated further from the momentum budget using high temporal and spatial resolution model data.
To delineate the horizontal moisture transport associated with the MBLJs and SLLJs, the vertical integrals of horizontal water vapor transport components [12,26] in the zonal and meridional directions are:
Q λ = 1 g P 0 P 1 q u d p
Q ϕ = 1 g P 0 P 1 q v d p
where, q is the specific humidity in kg kg−1, u is the zonal wind in m s−1, v is the meridional wind in m s−1, g is the acceleration due to gravity in m s−2, and P0 is the surface pressure in hPa, and P1 is the pressure at the top of the marine boundary layer in hPa, respectively. The magnitude of the horizontal moisture transport in the marine boundary layer is defined as:
I V T = Q λ 2 + Q ϕ 2
The moisture budget equation is given in Equation (2):
q ¯ t = V ¯ · q ¯ ω ¯   q ¯ p [ c ¯ e ¯ + ( q ω ¯ / p ) ]
where, q is specific humidity, t is time, V is the horizontal wind vector,   is the horizontal gradient operator, p is pressure, ω   is the vertical pressure velocity, c is the rate of condensation per unit mass, and e is the rate of evaporation per unit mass. The overbar refers to a horizontal average over a grid box.
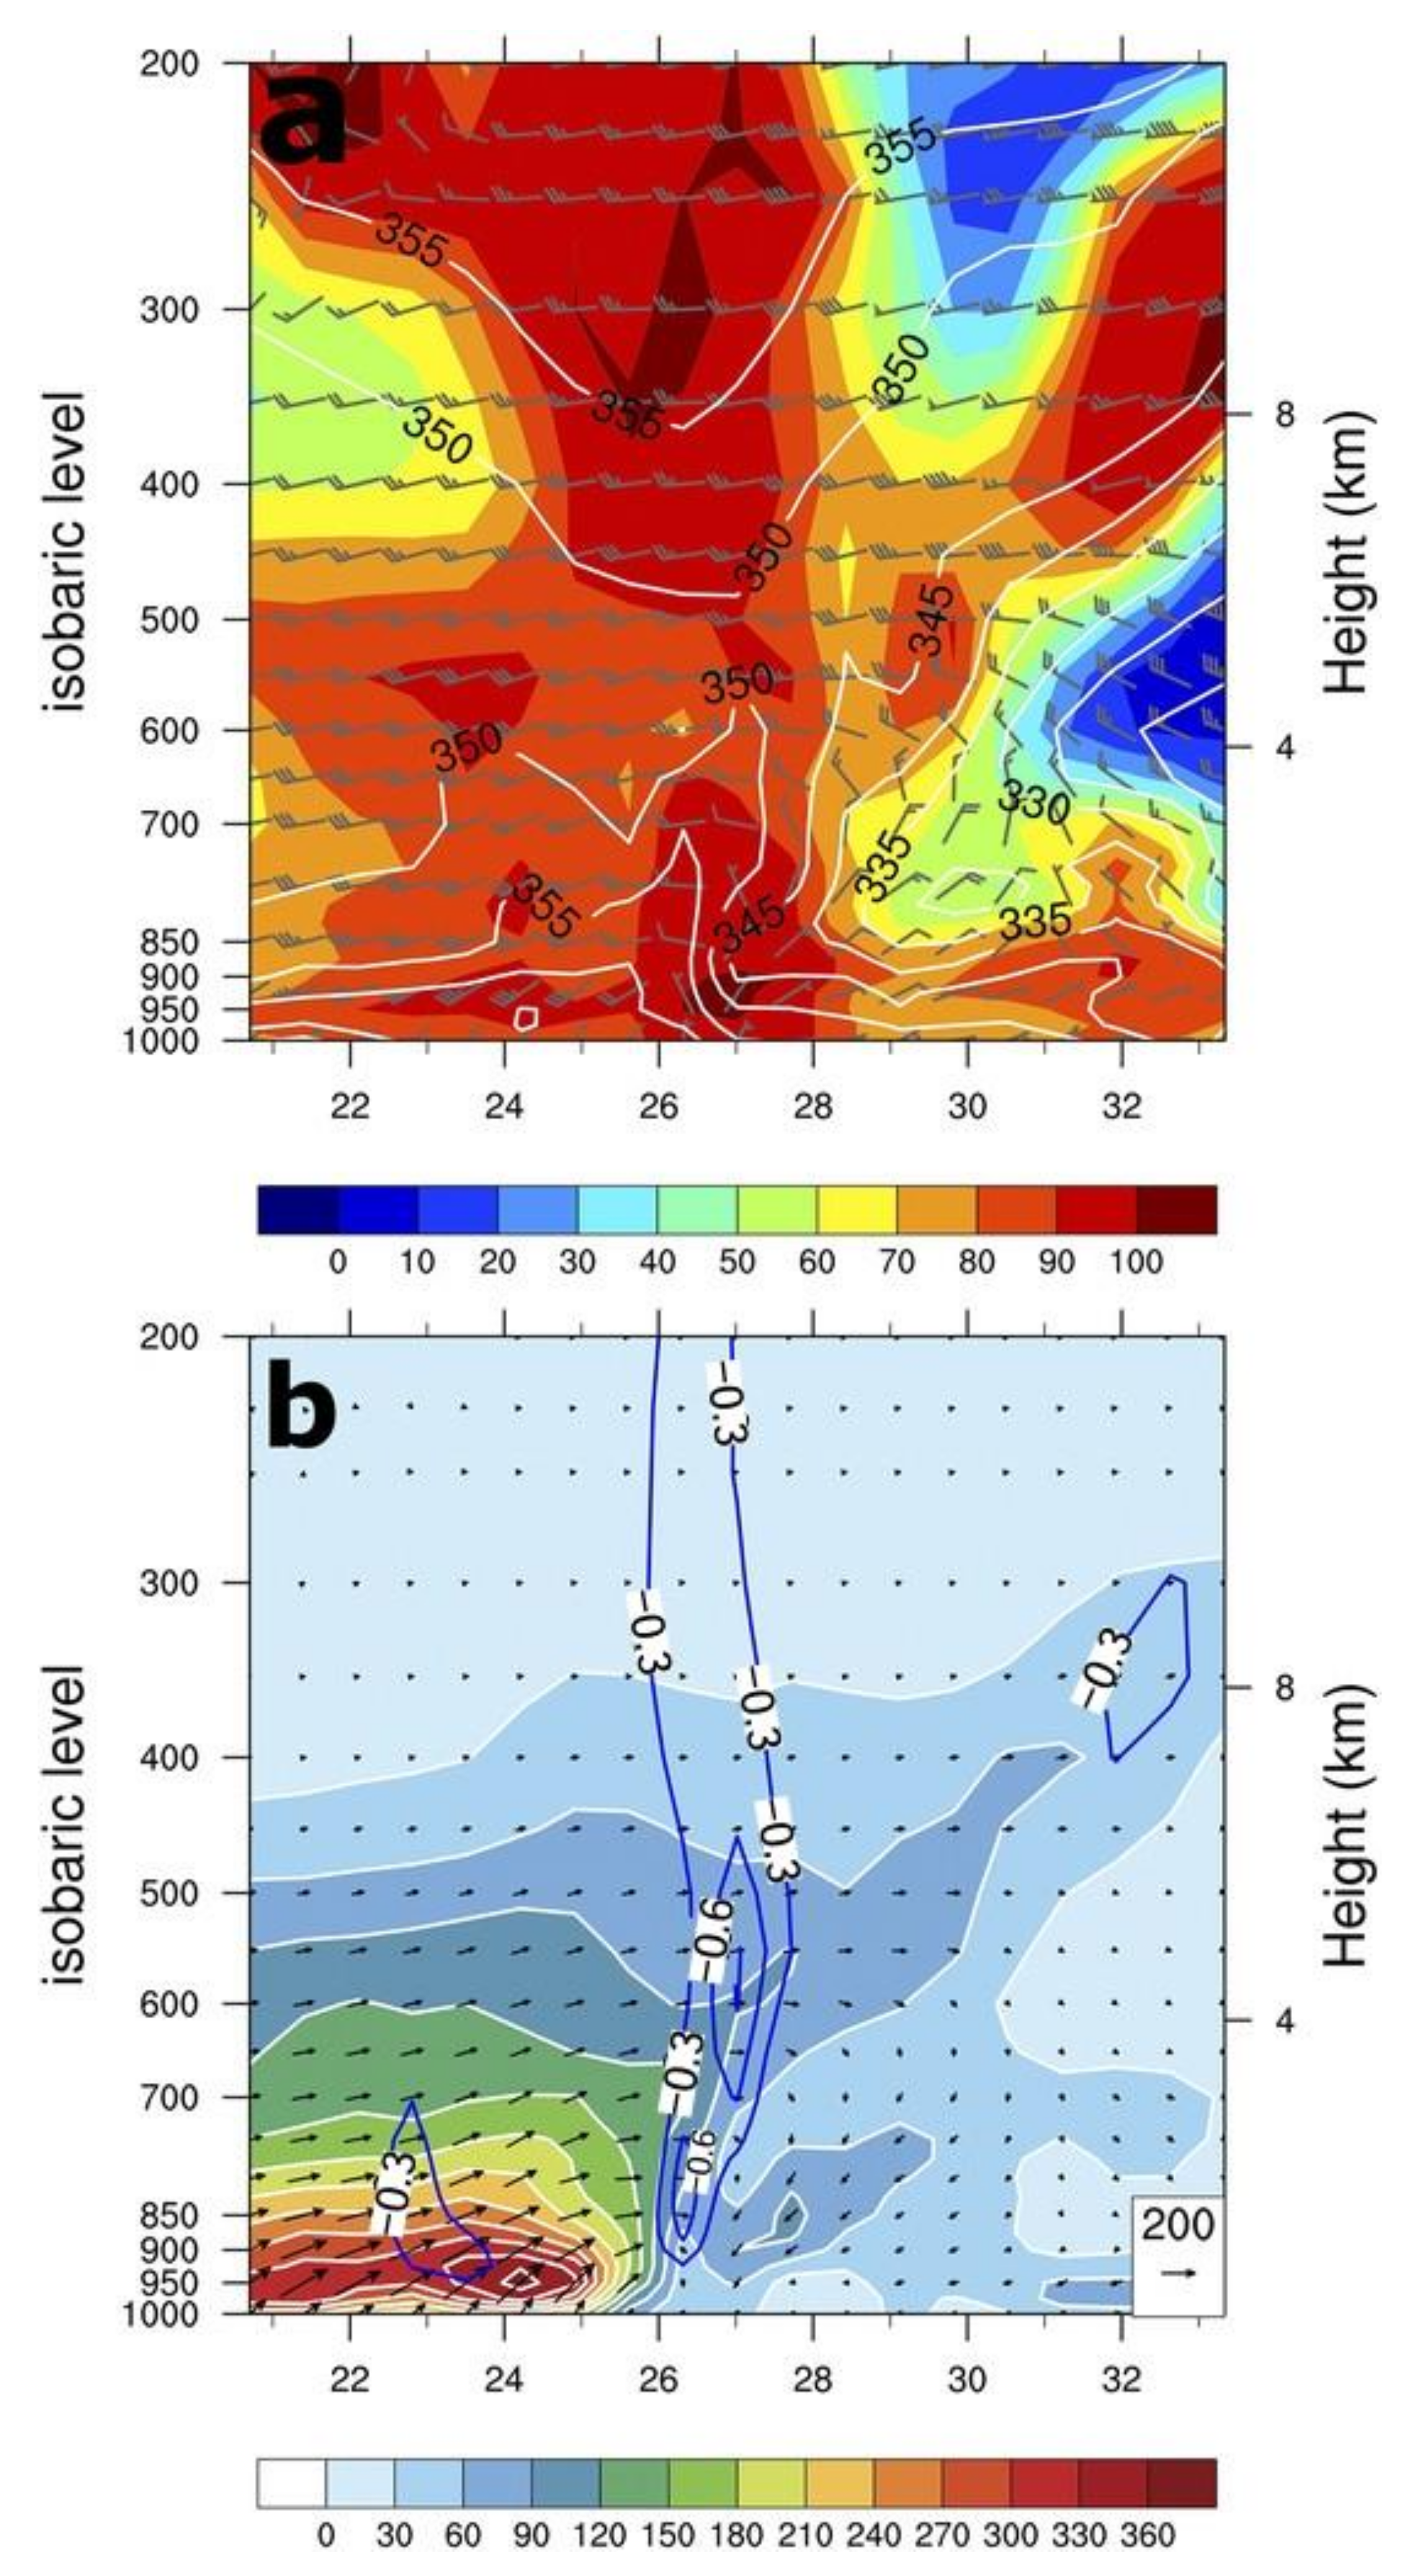
From the north (N)–south (S) cross-section along 116.5° E for the 21 MBLJ days [90], the SLLJ (~23° N) associated with the Mei-Yu frontal system has a wind speed maximum extending vertically upward above the surface front (Figure 18a). Similar to the 11–12 June 2012 case, the warm, moist high equivalent potential temperature air in the boundary layer is brought upward above the sloping frontal zone (Figure 18b,d). The MBLJ over the northern South China Sea exhibits a maximum wind speed around the 925 hPa level (Figure 18a) with a maximum horizontal moisture transport axis from the northern South China Sea to the Taiwan area at the 950 hPa level (Figure 18c). The jet core of the MBLJ is around 20° N, south of both the surface front and the SLLJ. From the moisture budget calculations, similar to the 20–23 May 1987 TAMEX case, the vertical advection term and the subgrid-scale transport term are the two dominant terms (Figure 19). The tendency and horizontal advection terms are one order of magnitude smaller. It is apparent that during the MBLJ days, significant horizontal moisture fluxes associated with the MBLJ provide abundant moisture to support occurrences of heavy rainfall over the Taiwan area. Otherwise, rainfall production occurs in the frontal zone due to mesoscale frontal lifting (Figure 2).
In the past, most of the moisture transport during the Mei-Yu season over Taiwan was attributed to SLLJs [28,31,32]. However, in contrast to these studies, our results from the case study presented by Chen et al. [77] and the composite analysis [58] clearly show the importance of the horizontal moisture transport below the 850 hPa level by the MBLJ from the south toward the Taiwan area (Figure 18). The equivalent potential temperature has a maximum in the frontal zone (Figure 11b) because the warm, moist air in the low levels is advected vertically upward above the sloping frontal surface [5,70,72,73,77]. In the absence of an MBLJ, the atmosphere over the northern South China Sea is relatively dry, despite the presence of the southwesterly monsoon flow [73].
In addition to the secondary circulation associated with the jet/front system, rainfall production can be related to orographic effects. Although heavy rainfall events are often associated with the passage of a frontal system or the drifting of mesoscale convective systems inland, these events frequently occur on the windward side of the Snow Mountains and the Central Mountain Range in the afternoon hours. The heavy rainfall events on the windward side are the result of orographic lifting of the southwesterly flow that is enhanced by daytime anabatic winds [7]. During the MBLJ days [58], moisture convergence over southwestern Taiwan and offshore (Figure 20), as well as orographic lifting on the windward slopes of the Central Mountain Range and Snow Mountains, are favorable for the development of localized heavy rainfall (Figure 1). This is consistent with the results of Yeh and Chen [66], C. S. Chen et al. [7,91], and Kerns et al. [8].
During TiMREX IOP #8 from 15–17 June 2008, a MBLJ is present in the absence of a Mei-Yu front and a moisture tongue extends from the northern South China Sea to the Taiwan area (Figure 21). During the passage of a 500 hPa short-wave trough [70] (not shown), localized heavy rainfall occurred over the southwestern coast (Figure 22a,b). This was caused by orographic blocking of the southwesterly monsoon flow and lifting of the incoming flow by the leading edge of the cold pool off the southwestern coast. The cold pool was the result of rain evaporative cooling by the preceding rainfall over southwestern Taiwan on 14 June [69,70]. At night, rain evaporation cooling is enhanced by nocturnal cooling. During the day, with extensive cloud cover and precipitation, the surface flow over southwestern Taiwan still exhibits an offshore wind component (not shown). As a result, rainfall along the southwestern coast persisted during the day, (Figure 22b) due to lifting of the MBLJ by the offshore flow.
Tu et al. [90] performed a cycling run, beginning 36 h before the model forecast at 1200 UTC 15 June 2008 with additional assimilated data to improve the model’s initial conditions provided by the NCEP Global Forecast System (GFS) to better study the heavy rainfall event over the southwestern coast of Taiwan. The assimilated data were taken from special TiMREX soundings, Global Telecommunications System (GTS) data, and the Constellation Observing System for Meteorology, Ionosphere and Climate (COSMIC) global positioning system (GPS) radio occultation (RO) refractivity profiles. The 36-h cycling run with data assimilation (WRFDA) provided improved subsynoptic flow and moisture fields in the model initial conditions when compared to the ECMWF Year of Tropical Convection (YOTC) [92] analysis. Furthermore, after a 36-h cycle run, the cold pool caused by the evaporative cooling of antecedent rains [69] is better resolved in the initial conditions of the high-resolution (3 km grid) domain when compared to TiMREX observations analyzed by Tu et al. [70]. As a result, coastal rainfall is well simulated at night and the next day (Figure 22c,d). With the south/southwesterly MBLJ incoming flow from the South China Sea (Figure 22b), northern Taiwan is in the wake zone with relatively weak winds (not shown). Afternoon sea-breeze/upslope flow develops there due to solar heating over land. The convergence of the afternoon sea breezes over the Taipei Basin (not shown) and afternoon rainfall over northern Taiwan (Figure 22d) are well predicted in the model. Similar rainfall patterns during 27–28 June 2008 were documented by C.-S. Chen et al. [93].
In the 15–17 June 2008 case, in contrast to the 10–12 June 2012 case (Figure 10) and June rainfall climatology (Figure 1), there is no significant rainfall maximum on the windward slopes of the Snow Mountains and the Central Mountain Range. This difference could be attributed to the difference in the impinging angle of the prefrontal southwesterly flow. In the 15–17 June 2008 case, the low-level MBLJ has a large southerly wind component (Figure 22). In the 10–12 June 2012 case, the rising motion advects the warm, moist prefrontal air upward and the elevated SLLJ at the 850 hPa level has a large westerly wind component (Figure 11) impinging on the Snow Mountains and the Central Mountain Range. High-resolution idealized model simulations [65] and case studies [91] have shown that orographic lifting is more significant if the impinging angle is larger.
From the analysis of the NCEP CFSR data, rain gauge data, and case studies during the South China Sea Two Island Monsoon Experiment (SCSTIMX) for the 2017 Mei-Yu season, Tu et al. [59] found that two periods of widespread heavy rainfall over Taiwan (1–4 June and 14–18 June 2017) were closely related to the large horizontal moisture transport within the MBL, from the northern South China Sea to the Taiwan area (Figure 23 and Figure 24). For both heavy rainfall periods, a MBLJ is present. With significant upstream moisture transport within the MBL (IVT > 300 kg m−1 s−1), extreme torrential rain (>500 mm day−1) occurs over Taiwan prior to, and during, the passage of a Mei-Yu jet/front system [60]. During the second widespread heavy rainfall period, there are two sub-periods (14 and 17 June) during which a MBLJ is present with IVT within the MBL of approximately 220–280 kg m−1 s−1. Rainfall peaks over Taiwan of greater than 300 mm day−1 occur on 14 and 17 June. During the first sub-period, Tropical Storm Merbok originates over the South China Sea on 11 June, moves over southern China before midnight on 12 June, weakens into a TD on 13 June, and then merges with the Mei-Yu trough over southern China. For the second sub-period, a Mei-Yu frontal cyclone develops and moves eastward over southern China along the large-scale Mei-Yu trough. For both periods (1–4 June and 14–18 June), a MBLJ develops and intensifies when the Mei-Yu trough over southern China deepens and/or the western Pacific subtropical high strengthens and extends westward. Tu et al. [59] suggest that the moisture transport within the MBL from the northern South China Sea to the Taiwan area is a favorable condition for heavy rainfall occurrences over Taiwan.
Orographic and local effects on the MBLJ may lead to the occurrence of localized heavy rainfall along the southern China coast during the early summer rainy season [55,83,94]. Du et al. [83] studied the initiation and growth of convection in the warm sector of a Mei-Yu front. The MBLJ-driven mesoscale ascent overlaying high SST over the northern South China Sea moistens the warm tongue off the southern China coast. As the jet intensifies and evolves from southwesterlies to nearly southerlies, the convergence at the northwestern and northeastern edges of the MBLJ is favorable for the development of localized rainfall. The flow interaction with the coastal hills of south China is also an important factor in convection initiation and growth in the warm sector [94].

4. The Barrier Jet

There are several types of coastal boundary layer jets in various parts of the world. They are typically the result of large-scale pressure gradients, which are modified by diurnal and orographic effects related to adjacent coastal terrain. These include the New York Bight jets during spring and summer [95], coastal LLJs off the eastern China coast in July [54], summertime coastal jets off the California coast [96], LLJs off the western coast of subtropical South America [44,97,98], and easterly Caribbean LLJs [39,40]. With the presence of high mountains, coastal jets are frequently observed along the northwestern coast of Taiwan during southwesterly monsoon flow [61,63].
The barrier jet (BJ), with a local wind speed maximum around the 1 km level off the northwest Taiwan coast, is another type of LLJ that occurs during the Mei-Yu season (Figure 25). As the Mei-Yu jet/front system approaches the Taiwan area, the axis of the SLLJ also moves southward. As the SLLJ impinges on the island terrain, a windward ridge-leeside trough pressure pattern is observed due to island blocking under a small Froude number [< O (1)] flow regime [61,63]. The incoming southwesterly flow decelerates upstream off the southwestern coast as it encounters orographically induced high pressure with a splitting flow offshore. The deflected airflow along the western coast of Taiwan accelerates down the pressure gradient with a large cross-contour wind component, resulting in a BJ over the northwestern Taiwan coast (Figure 26). The BJ is strongest when the windward ridge-leeside trough pressure pattern is most significant. The BJ weakens after a surface front arrives. Although station 46685 (Figure 27) is not located at the center of the jet core as observed by aircraft, the average profile of the speed in the direction parallel to the jet (vs) has a maximum greater than 14 m s−1 at approximately the top of the mixed layer (~1 km). The vertical wind shear is about 10 × 10−3 s−1 below the jet level and 4 × 10⁻³ s−1 above the jet (Figure 28). Li and Chen [63] suggested that even though the alongshore pressure gradient is largest at the surface, the observed wind speed maximum is not at the surface due to the frictional force in the lowest levels.
Yeh and Chen [65] conducted high-resolution (7 km) simulations over the Taiwan area using the fifth-generation Pennsylvania State University-National Center for Atmospheric Research (PSU-NCAR) nonhydrostatic Mesoscale Model (MM5) to investigate the orographic effects on the mesoscale airflow under a prevailing southwesterly flow over Taiwan. They did not use radiative forcing, thermal forcing from the surface, or synoptic forcing in their model runs. The model was initialized with the 1200 UTC May 1987 sounding (Figure 29) from Tungsha Island (Station 46810, 20.7° N, 116.72° E) (Figure 27) in the northern South China Sea. Orographically induced low-level strong winds along the northwestern coast of Taiwan were well simulated (Figure 30). At the barrier jet level (~1 km), the momentum balance along the northwest coast of Taiwan was dominated by both the inertial advection term and the pressure gradient force term. The significant Lagrangian flow acceleration of the northern branch of the deflected airflow along the coast is due to the pressure gradient force as the airflow moves down the orographically induced pressure ridge. Yeh and Chen [65] also confirmed that, within the mixed layer, the alongshore force balance is a three-way balance among inertial advection, the pressure gradient force, and the frictional force. Normal to the jet direction, the flow is approximately in geostrophic balance. Model sensitivity tests show that the location and strength of the orographically induced low-level strong winds also depend on the impinging angle and wind speed of the prevailing winds. Model results by Lin et al. [99] show that the barrier jet is the strongest before sunrise when the land surface is the coldest and approximately 3 m s−1 stronger than the afternoon minimum. This is consistent with observations [100].

5. The Interactions of the Three Types of LLJs on Heavy Rainfall over Taiwan

One of the important findings of TAMEX was the role of localized convergence between the BJ and frontal wind shift line [60,62,76,77,101] or the southwesterly flow [64] off the northwestern/western Taiwan coast on the development of deep convection under favorable large-scale settings. The orientation and depth of the Mei-Yu front also impacts the rainfall pattern as the front interacts with the island terrain. This section briefly reviews a few examples.
Li et al. [62] studied an unexpected heavy rainfall event (>231 mm) that occurred along the northwestern coast during TAMEX IOP #13 during 24–25 June 1987 using upper-air, surface mesonet, and dual-Doppler radar data. As a NE–SW oriented Mei-Yu front moved southeastward from southern China to the Taiwan area, the shallow (~1 km) postfrontal cold air in the lowest levels was decelerated by the hilly terrain along the southeastern China coast. As a result, a low-level wind shift line associated with a pressure trough at the 850 hPa level moved over the terrain along the southeastern China coast into the Taiwan Strait before the arrival of the Mei-Yu frontal boundary at the surface. The large scale settings of this event were characterized by: (1) a SLLJ with a wind speed about 13 m s−1 ahead of the 850 hPa trough; (2) low-level winds veering with respect to height, suggesting warm advection in the prefrontal atmosphere; (3) an axis of high equivalent potential temperature in the prefrontal atmosphere with large equivalent potential temperature gradients between the warm, moist SLLJ and the relatively dry and cold northeasterly flow behind the Mei-Yu trough; (4) coupling between the low-level forcing (warm advection and frontal lifting) and upper-level divergence in the diffluent airflow region on the northeastern flank of the South Asian anticyclone.
A long-lived rainband developed over the northern Taiwan Strait between the barrier jet and the northwesterly flow behind the wind shift line (Figure 31). The rainband consisted of several long-lived (>2 h) reflectivity maxima at different stages of its life cycle. The reflectivity maxima formed on the southwestern tip of the rainband and intensified during their movement from the southwest to the northeast. During the mature stage, the reflectivity maxima were rooted within the low-level convergence zone approximately 3 km deep and tilted southeastward with height with sinking motion in the lower troposphere. The continued generation of the reflectivity maxima along the localized convergence zone maintained the long lifecycle of the rainband, resulting in persistent heavy rainfall along the northwestern coast as the reflectivity maxima moved onshore. During the early stage of the rainband’s development, the reflectivity maxima on the northeastern part of the rainband merged with the convective line associated with the land breeze front.
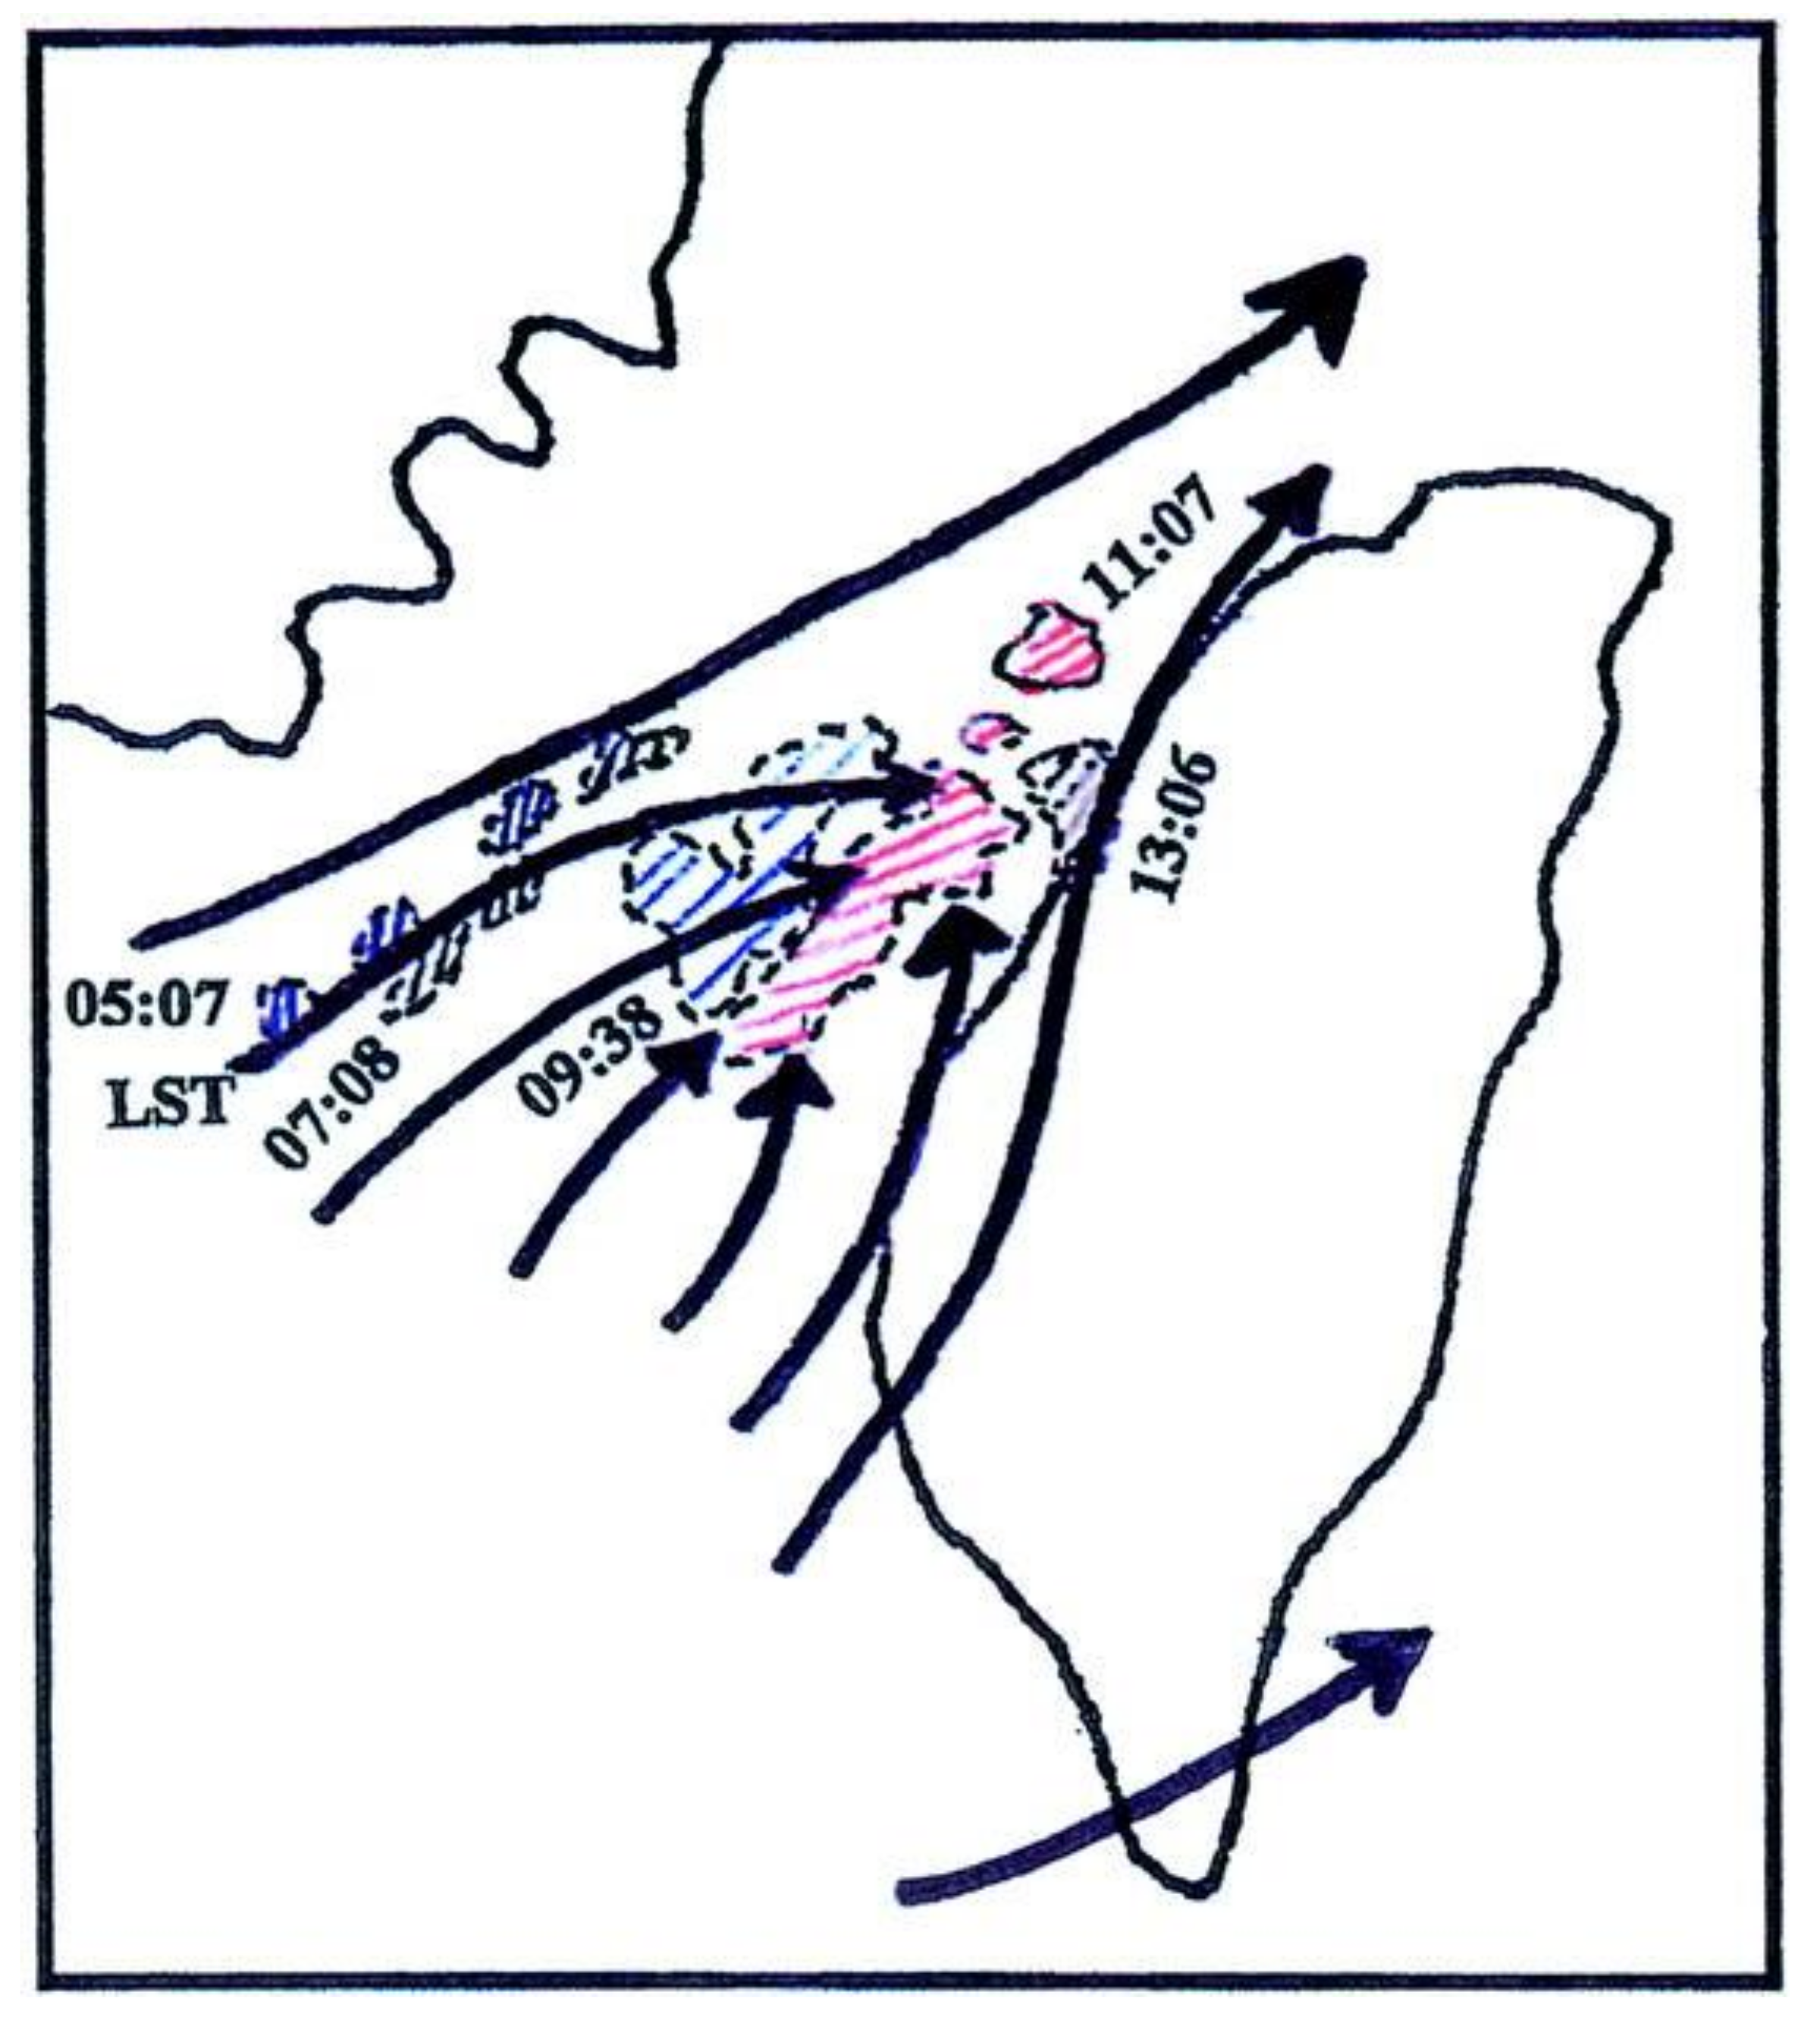
During TAMEX IOP #3 from 21–22 May 1987, a rainfall maximum of more than 40 mm h−1 occurred along the western/northwestern coast of Taiwan under favorable large-scale settings. This event occurred under large-scale rising motion ahead of the 850 hPa jet/front system. Concurrently, an upper-level trough deepened and moved toward South China [61]. A SLLJ greater than 15 m s−1 ahead of the 850 hPa trough impinged on the Central Mountain Range. A barrier jet developed off the northwestern Taiwan coast due to orographic blocking (Figure 25). During 1000–1600 local standard time (LST), three rainbands formed in succession within the orographically induced convergence zone over the Taiwan Strait. The deflected southerly flow converged with the prevailing southwesterly flow, which was modified by the storm-induced westerlies immediately behind the convective line (Figure 32). Modeling results confirmed that the localized convergence off the northwestern coast was caused by orographic effects and the convective feedbacks.
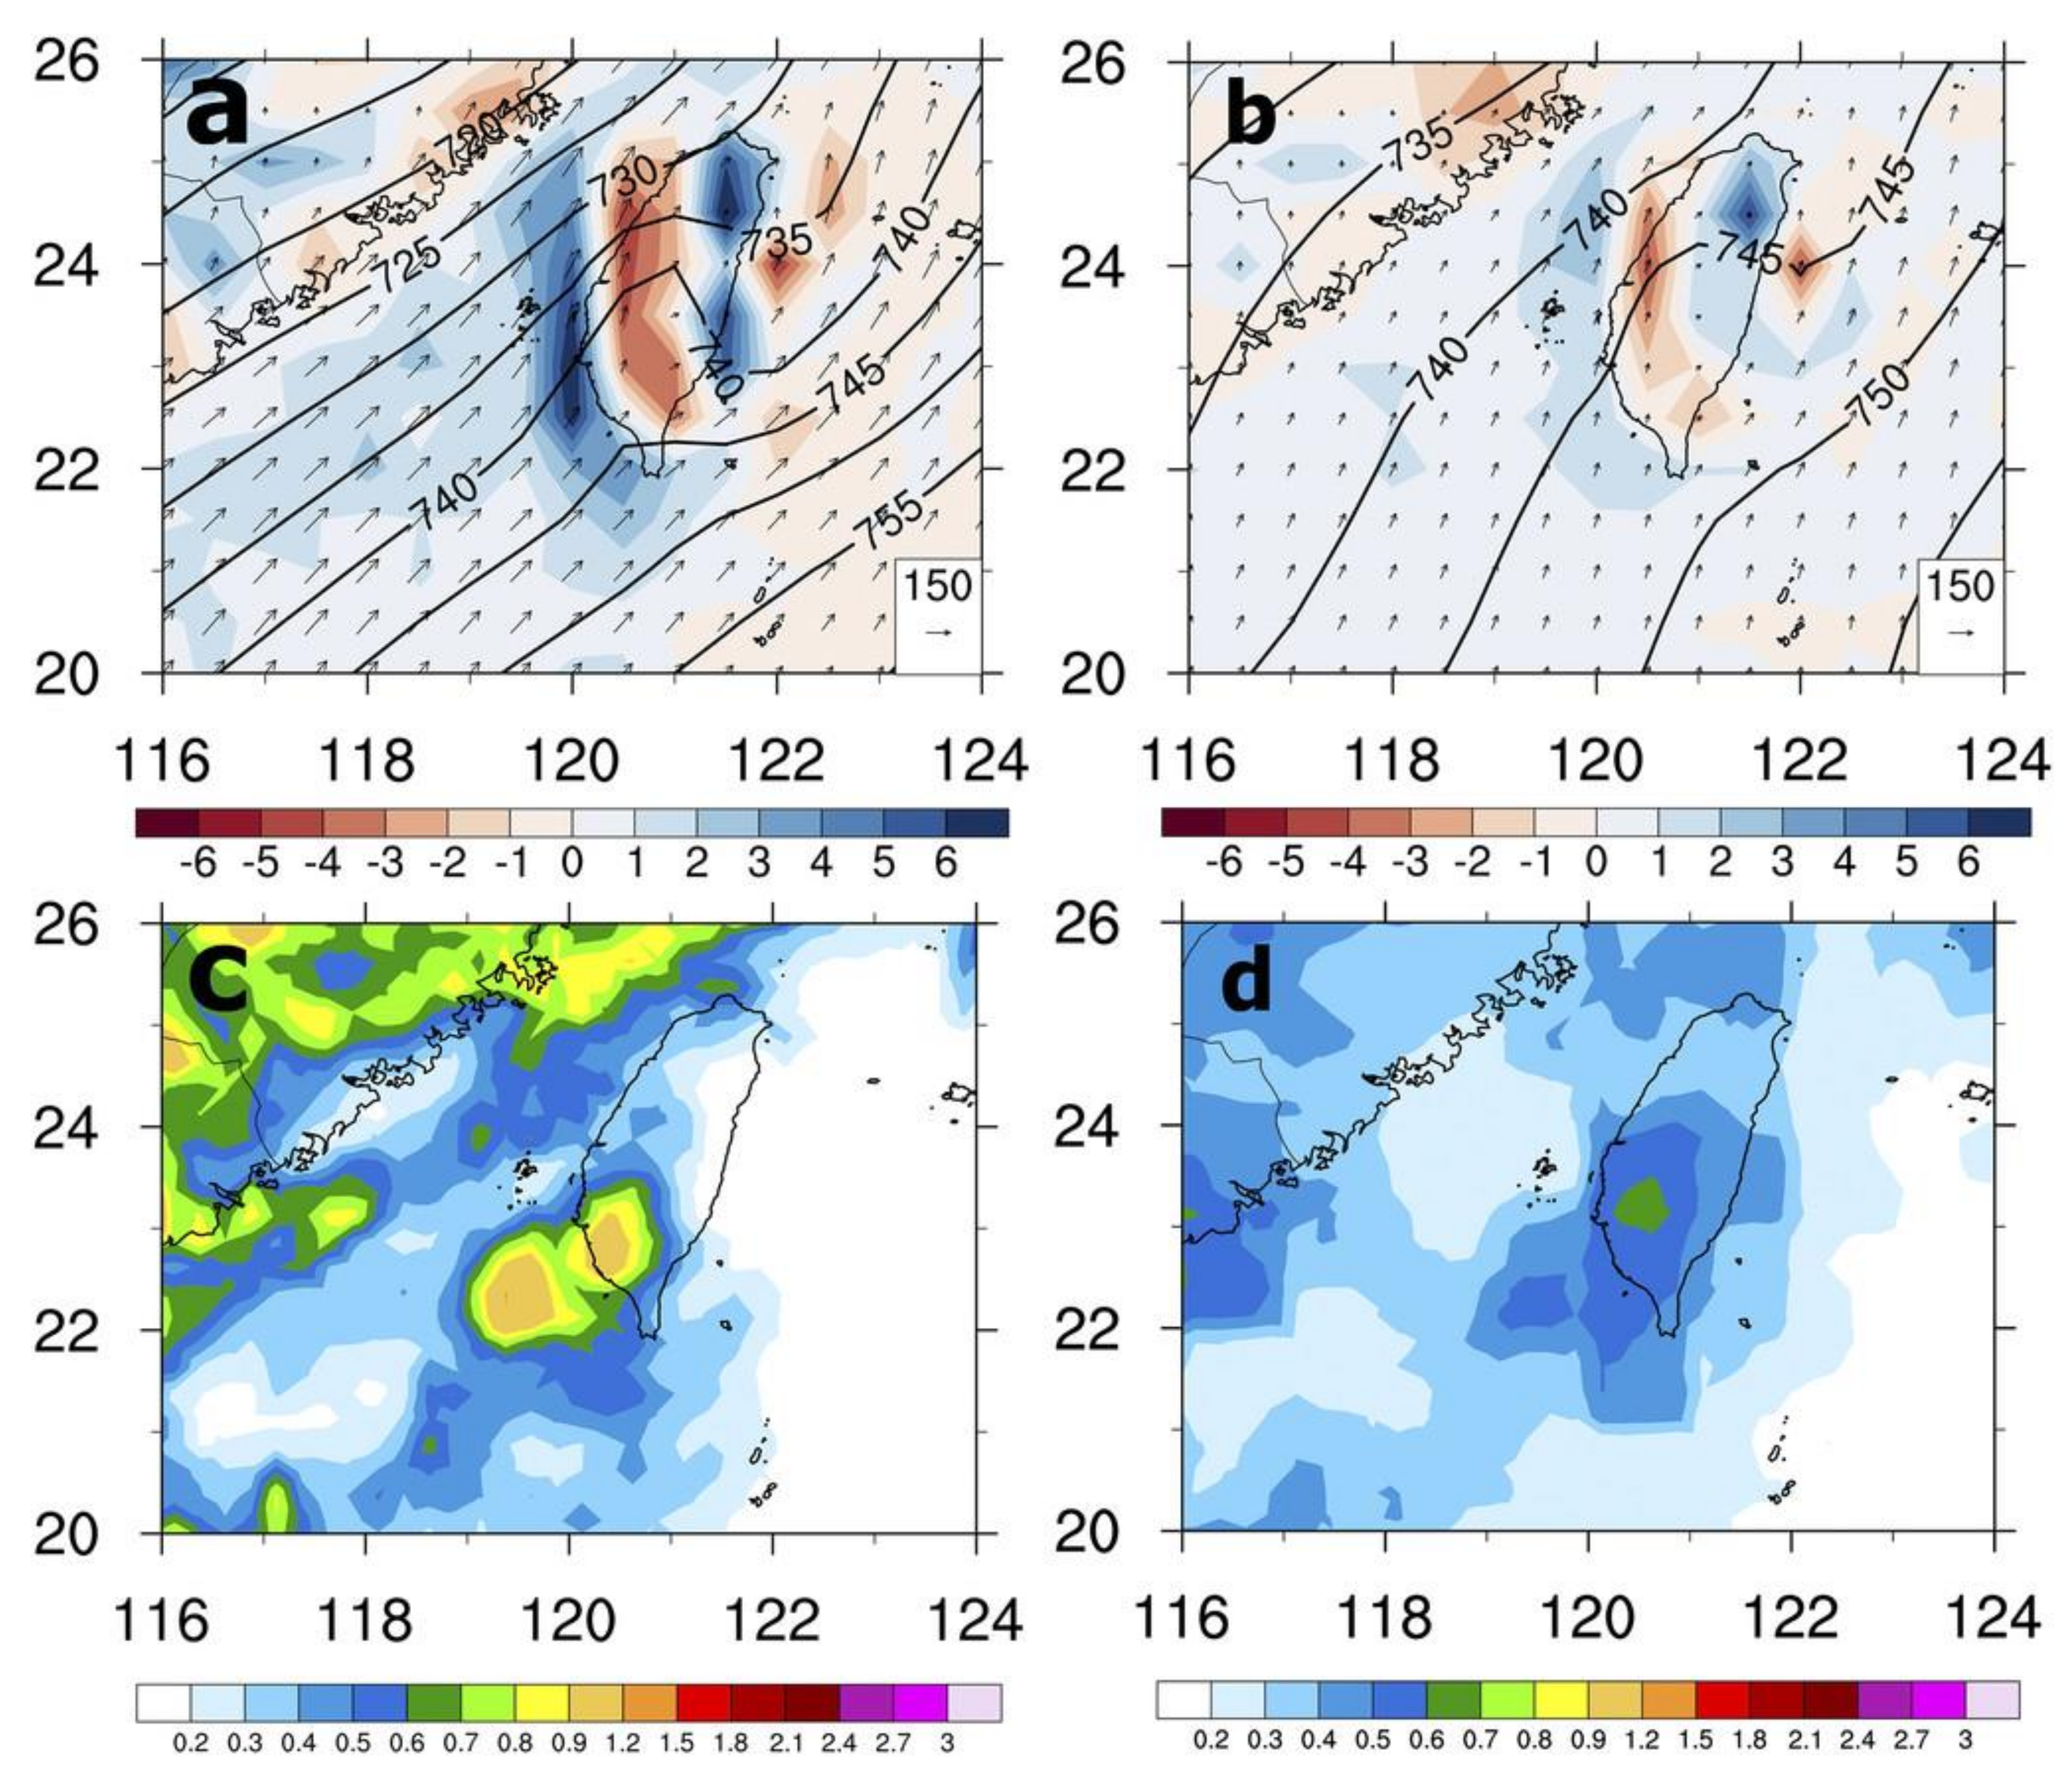
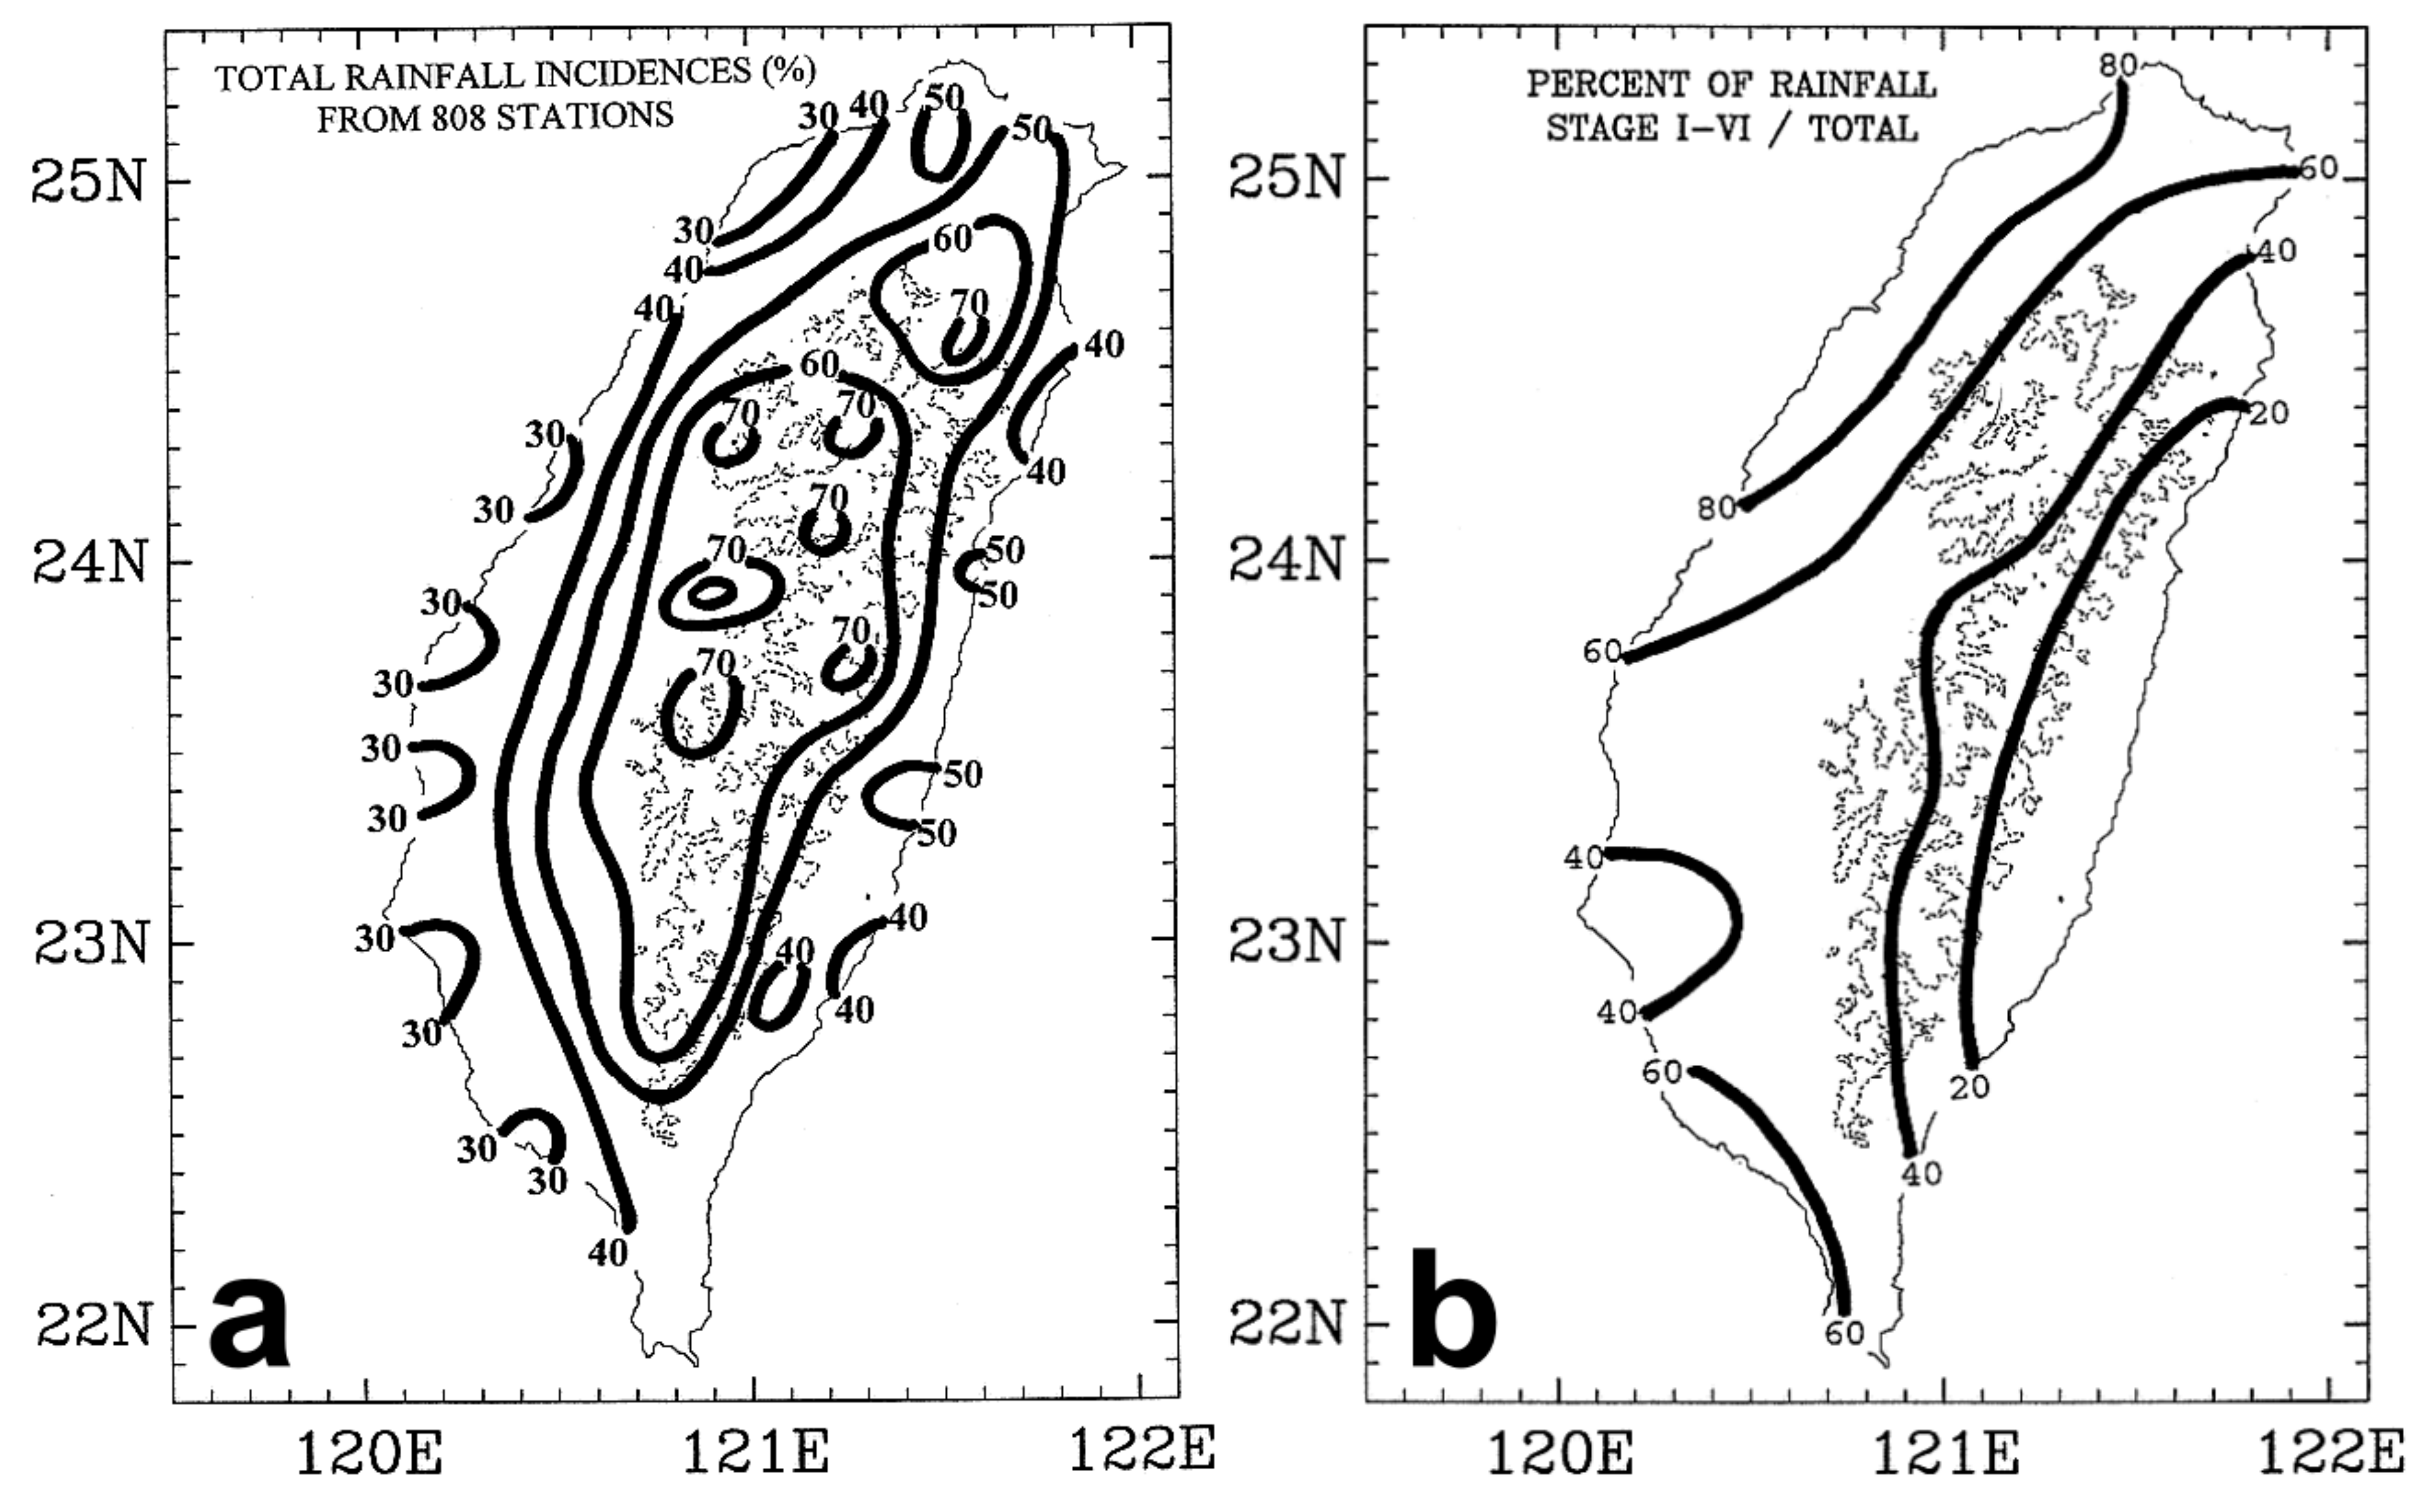
During TAMEX, daily rainfall incidences along the northwestern/western coast were less than 40% (Figure 33a). Nevertheless, more than 80% of rainfall there occurred during the passage of Mei-Yu systems (Figure 33b). It is apparent that during frontal passages, the barrier jet plays an important role in enhancing the amount of rainfall over the northwestern and western coasts [62,64]. In contrast, over the island interior, daily rainfall incidences are greater than 60–70% (Figure 33a), but less than 50% of total rainfall amount there occurs during frontal periods [66] (Figure 33b). Model simulations by Tu et al. [60] indicated that the barrier jet also transports moisture to the frontal zone (Figure 34), which is consistent with previous studies [8,62,76,77].
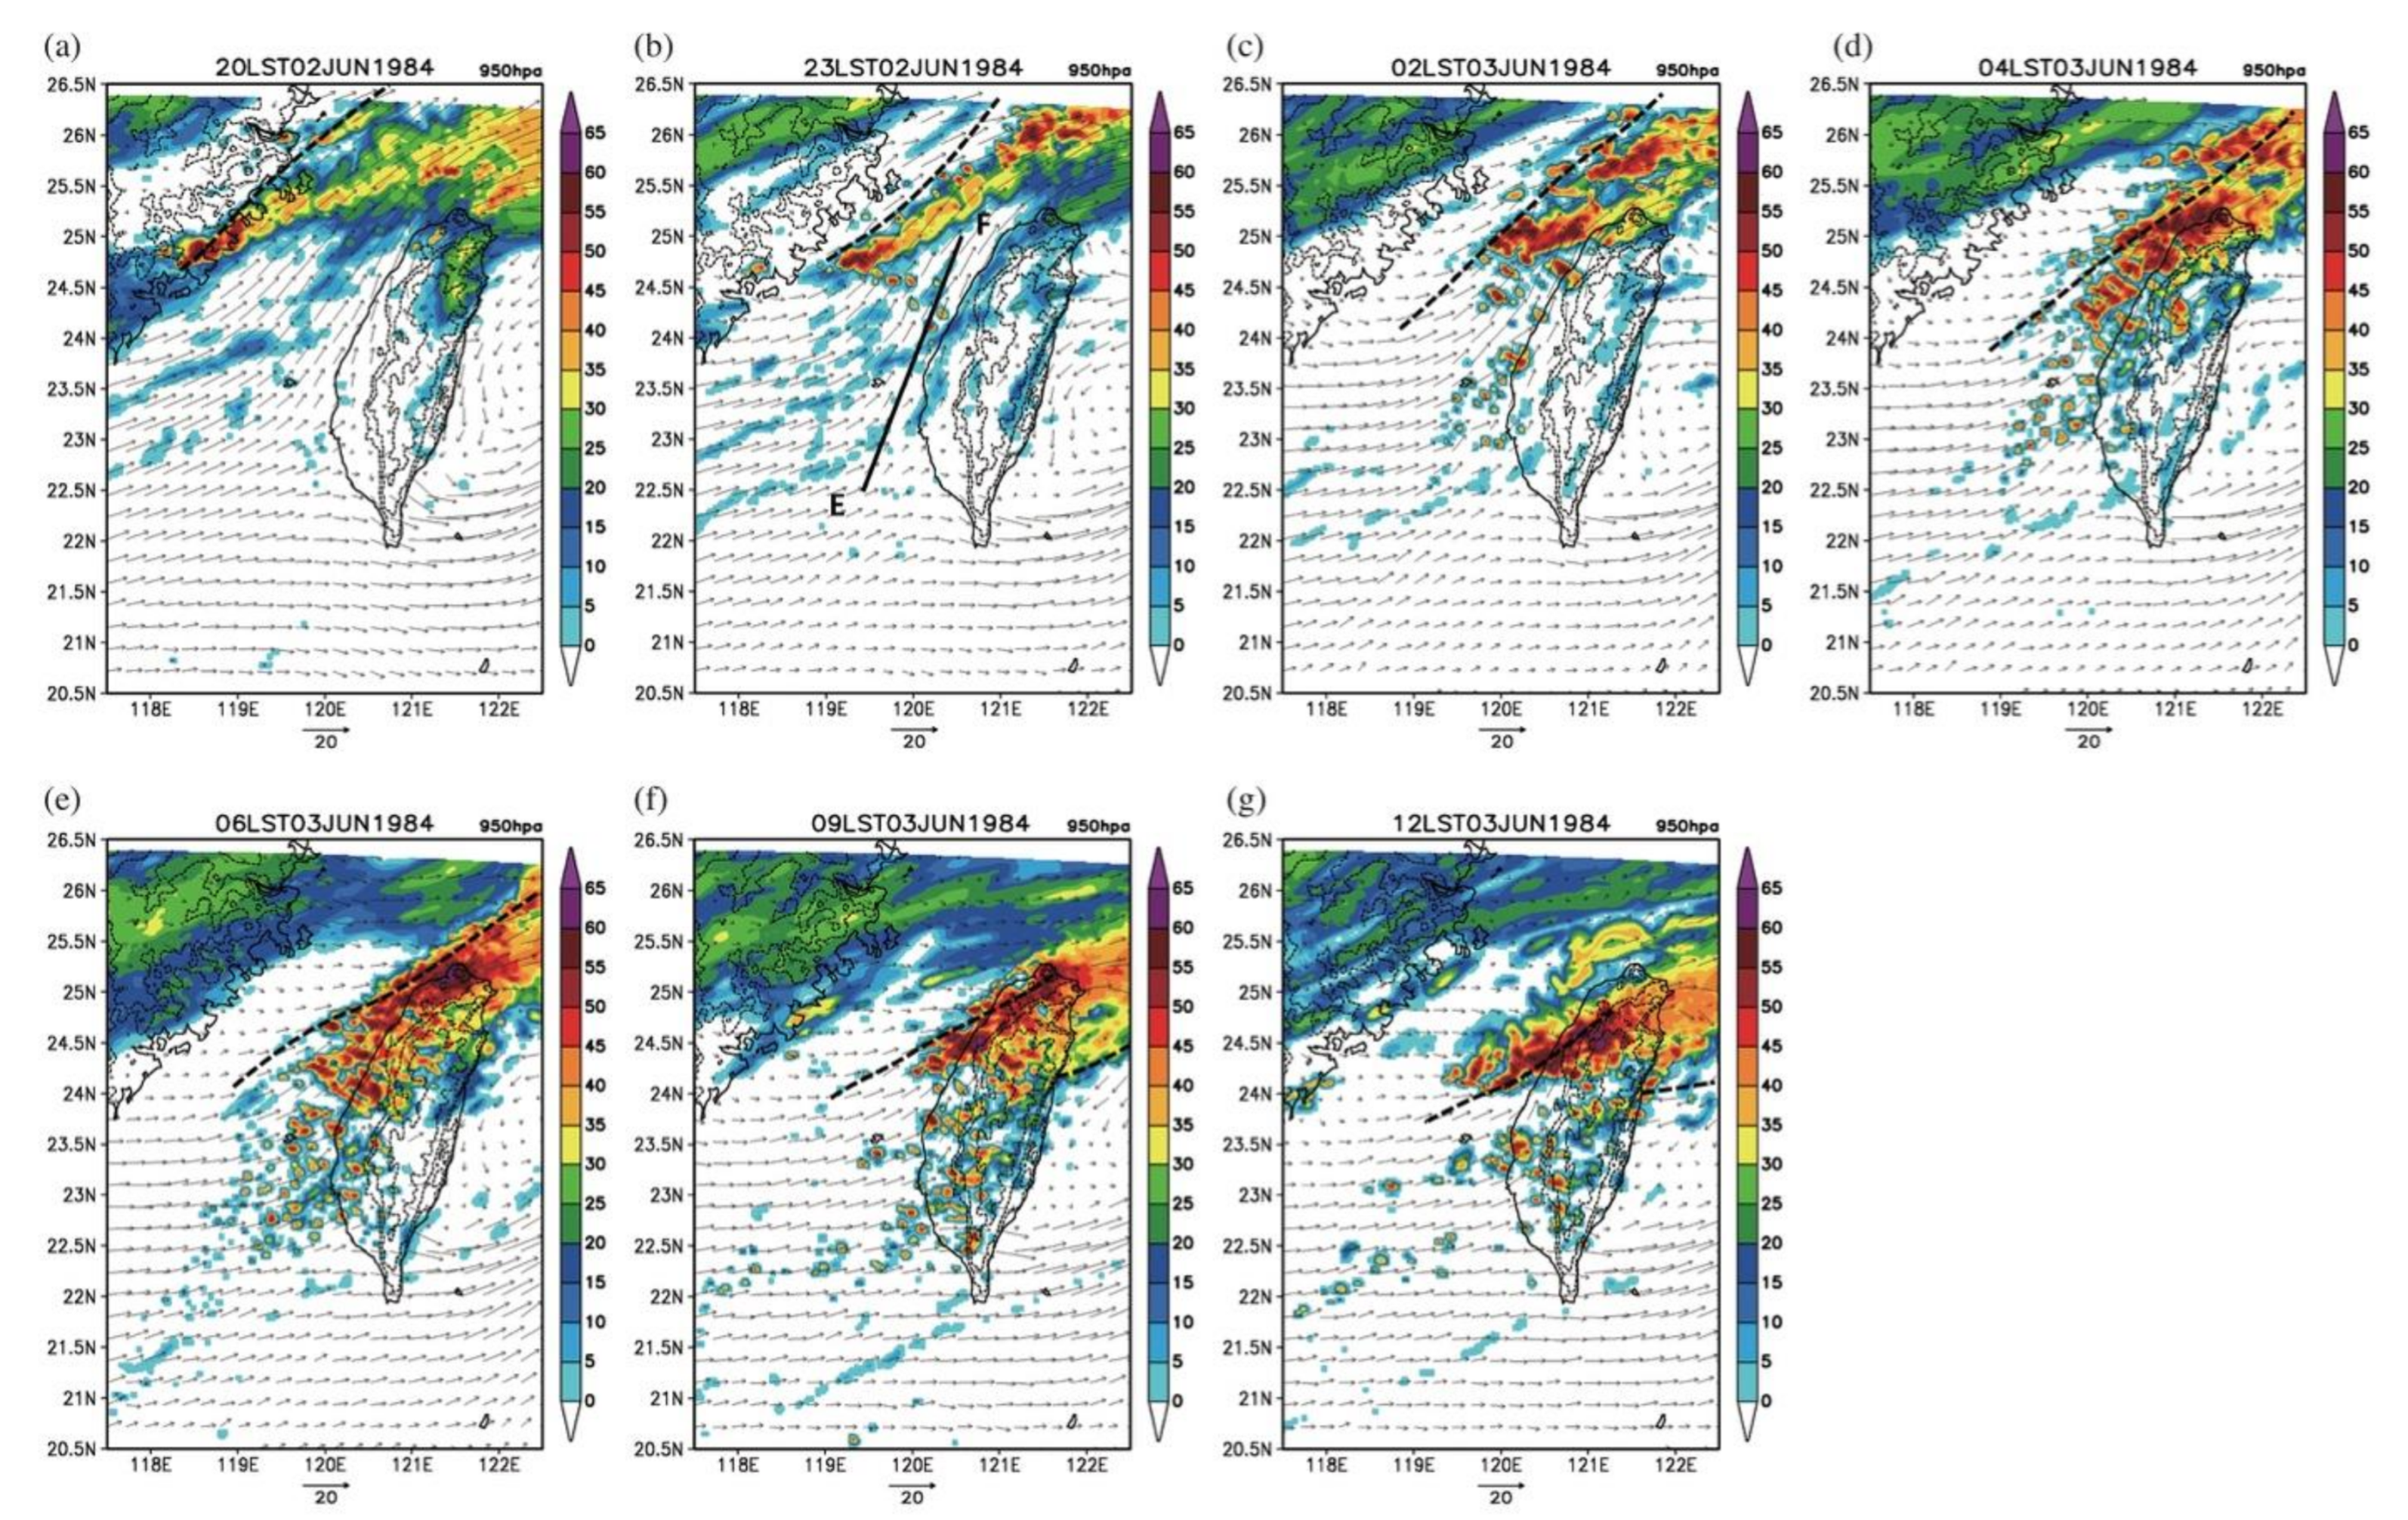
For a NNE–SSW oriented Mei-Yu front that occurred on 3 June 1984 [76], the pre-existing rainfall was enhanced as the front moved over the northeastern Taiwan Strait, where the prevailing southwesterly winds converged with the orographically deflected flow, with a southerly wind component off the western/northwestern Taiwan coast. As the pre-existing convective rainfall continued to move toward northern Taiwan, it was enhanced in a localized low-level convergence zone over the northwestern coast, where a barrier jet converged with the northwesterly winds behind the surface front (Figure 35). Furthermore, on the morning of 3 June 1984, rainfall was simulated where the barrier jet encountered the leading edge of the cold pool caused by rain evaporative cooling, as suggested by Chiou and Liu [102].
Chen et al. [77] studied the interaction between an E–W oriented Mei-Yu jet/front system and topography for a heavy rainfall event over northern Taiwan during 11–12 June 2012. All three jets (SLLJ, MBLJ and BJ) co-existed in this event. In this case, in addition to excessive rainfall on the windward sides of the Snow Mountains and the Ali-Shan Mountains (Figure 10), there was a maximum rainfall accumulation (~435 mm) over the northwestern Taiwan coast and another rainfall maximum of approximately 477 mm within the Taipei Basin (Figure 36). The MBLJ brought in excessive moisture from the northern South China Sea (Figure 12b), while the secondary circulation (Figure 12a) associated with the SLLJ (Figure 11) provided the large-scale lifting mechanism, and local effects by the BJ and front-terrain interaction determined the timing and distribution of localized heavy rainfall during the frontal passage over northern Taiwan (Figure 36). From 2200 LST 11 June to 0200 LST 12 June, the rainfall maximum along the northwestern coast was related to the arrival of scattered prefrontal radar echoes, followed by the convective line associated with the Mei-Yu front (Figure 36a–d). The convective activities over the northwestern coast were enhanced by the localized convergence between the southerly BJ and the postfrontal west-northwesterly flow. From 0200–0800 LST 12 June, the relatively deep postfrontal cold air, approximately 1.5 km deep, moved over the Yang-Ming Mountains, with peaks approximately 1120 m in height, into the Taipei Basin as the Mei-Yu front arrived with cold northeasterlies near the surface and northwesterlies behind the 850 hPa trough. In this case, the Mei-Yu front stalled, resulting in heavy precipitation over the Taipei Basin for 6 h (Figure 36e–g). Additionally, the 850 hPa postfrontal northwesterlies impinged on the northwestern slopes of the Snow Mountains, which resulted in heavy orographic precipitation there (Figure 36h) as the Mei-Yu system continued to advance southward. A schematic diagram is given in Figure 37.
Tu et al. [60] studied another unusually heavy rainfall event along the northern coast of Taiwan during 1–2 June 2017 (Figure 38). In this case, all three types of low-level jets (SLLJ, MBLJ, and BJ) co-existed and, again, the timing and distribution of localized heavy rainfall over northern Taiwan were determined by front-terrain interaction. In contrast to the case studied by Chen et al. [77], the E–W oriented shallow Mei-Yu front (less than 850 m) was anchored over the northern side of the Yang-Ming Mountains, with peaks approximately 1120 m high, for 8 h (Figure 39a) during the early morning (0200–1000 LST) (Figure 38a–f). Persistent orographic rainfall along the northern coast resulted in a rainfall accumulation of more than 600 mm. As the postfrontal cold air continued to push southward, eventually the cold air was able to pass over the Yang-Ming Mountains (Figure 39b) and moved into the Taipei Basin, which had a Mei-Yu frontal rainband (Figure 38g). Furthermore, the southwesterly BJ converged with the postfrontal northwesterly flow, resulting in a local rainfall maximum over the northwestern coast (Figure 38g). As the Mei-Yu front continued to advance southward, orographic precipitation occurred over the northwestern slopes of the Snow Mountains as the northwesterly flow behind the 850 hPa trough impinged on the Snow Mountains.
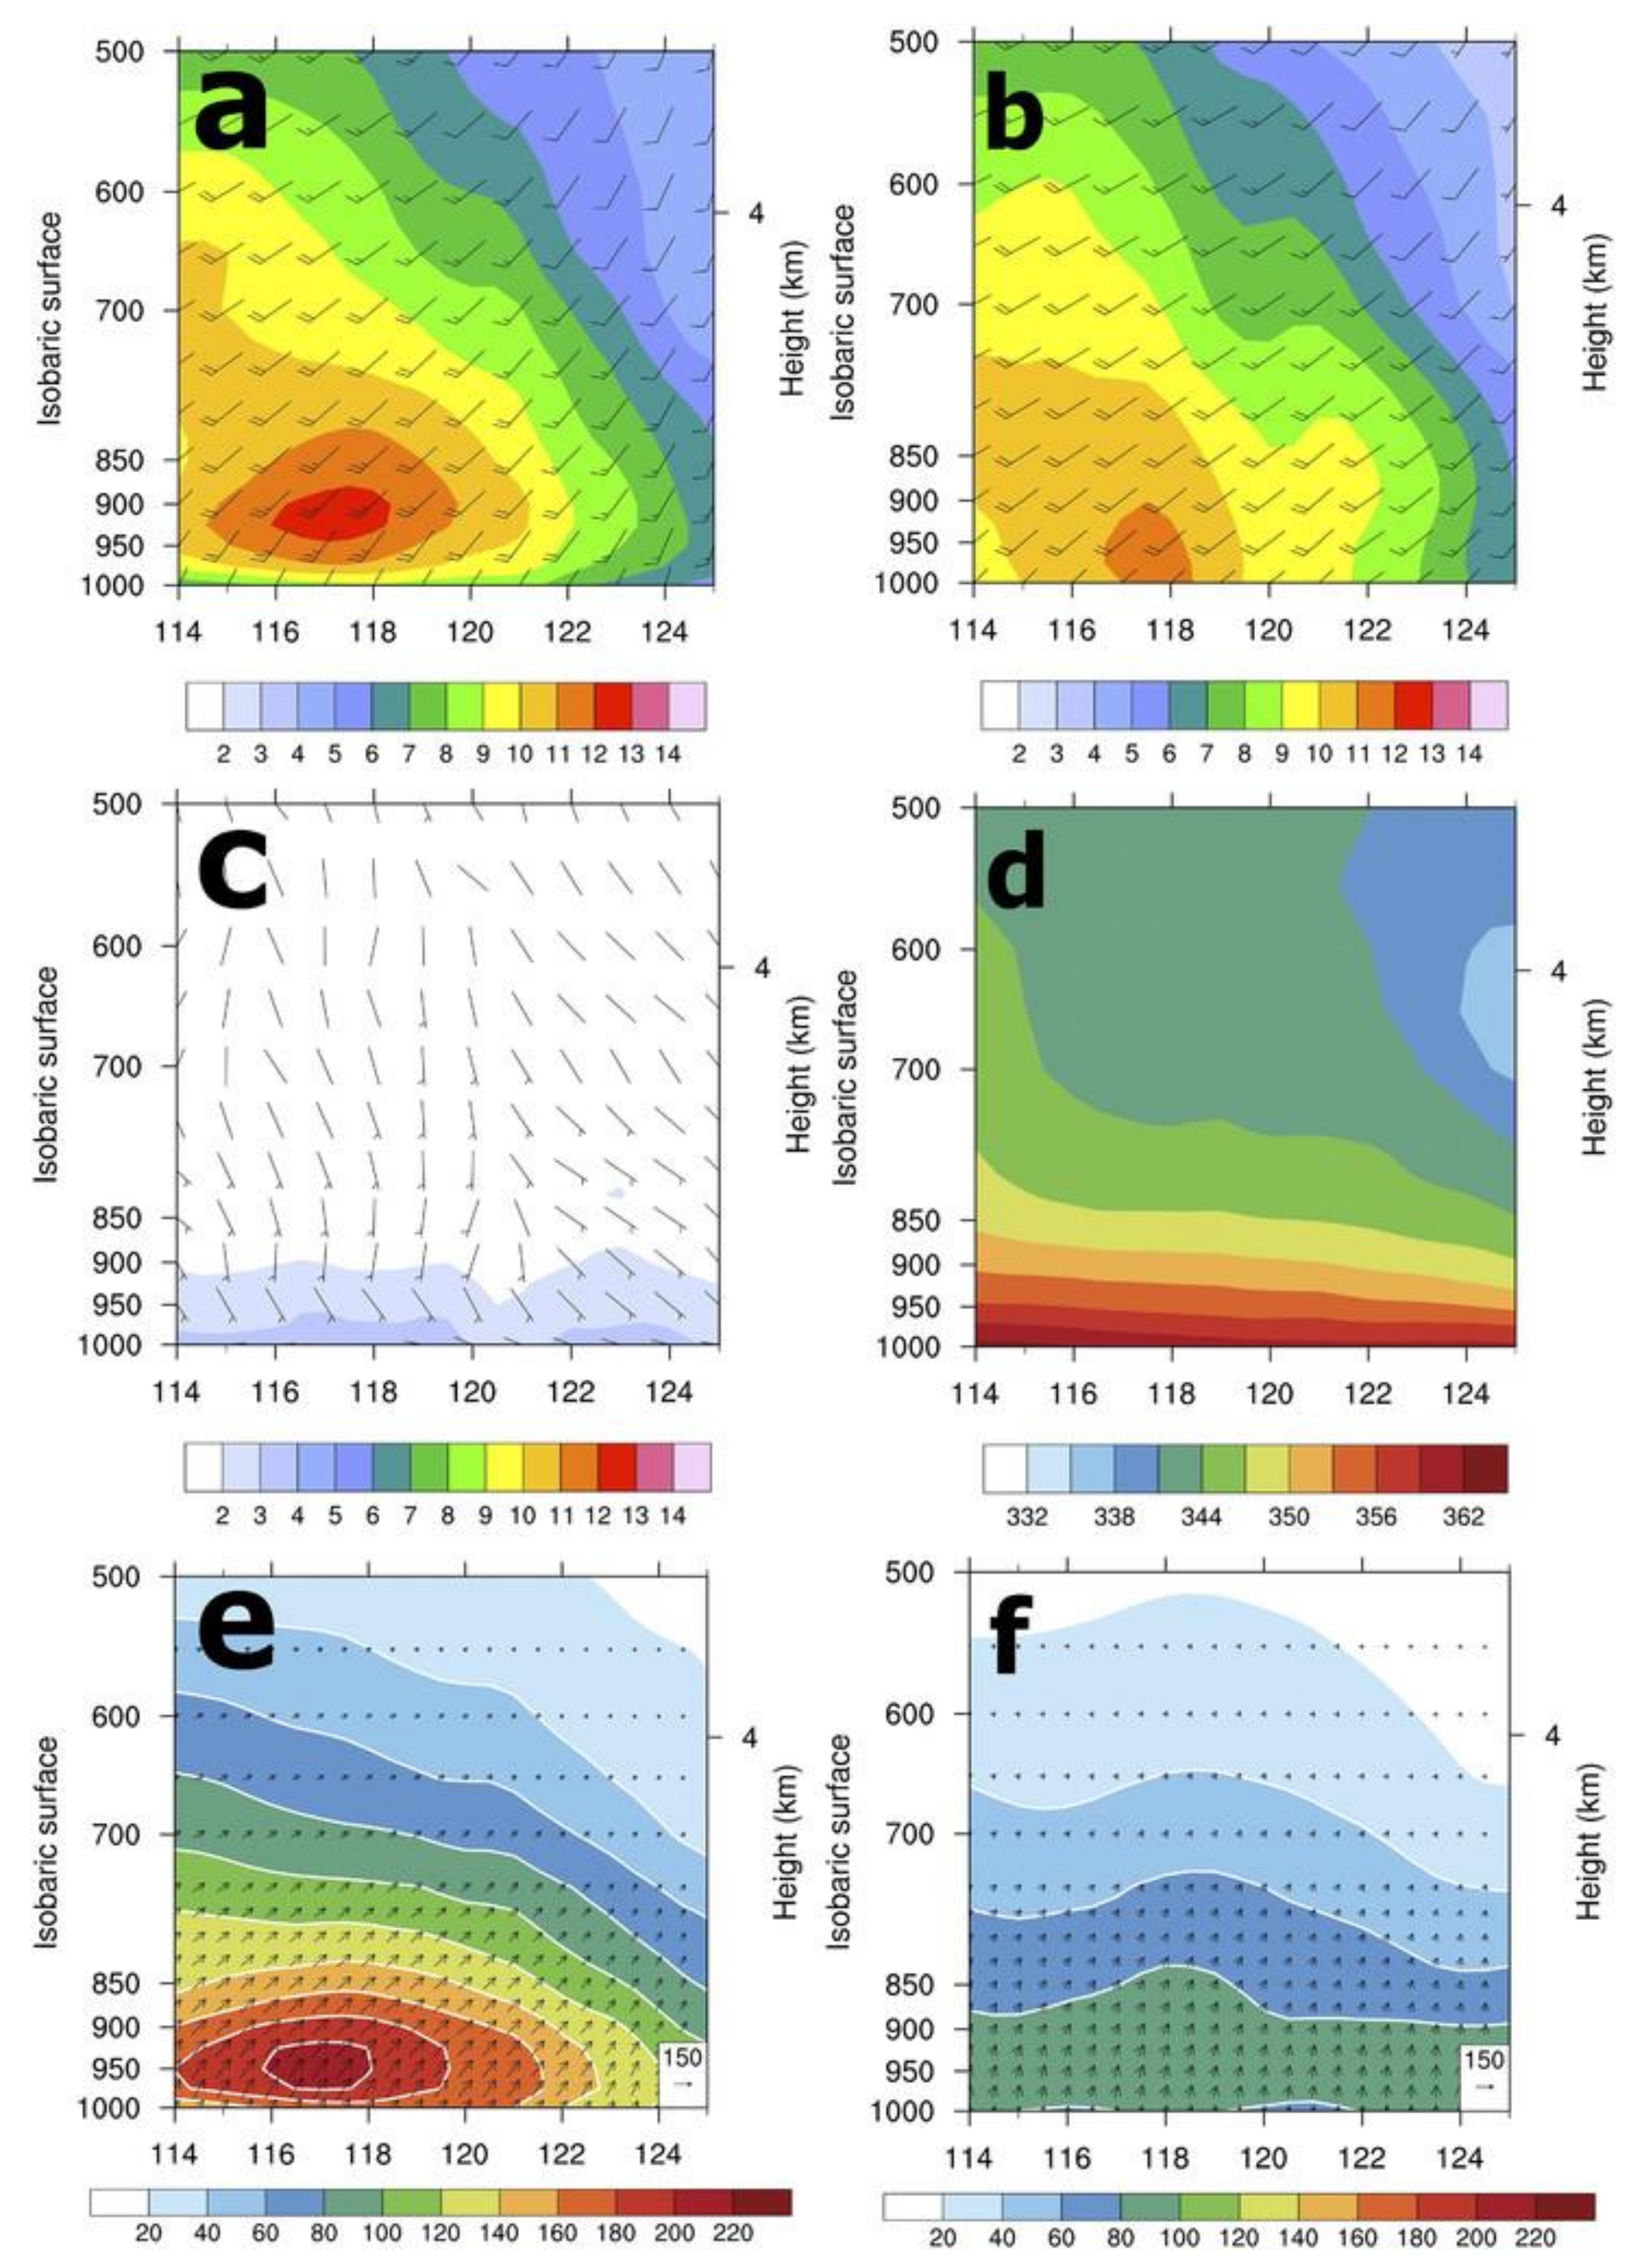
From the composite for 21 MBLJ days during 2008–2012 (Table 1), the NE–SW cross section (Figure 12) through the Taiwan Strait reveals the existence of a horizontally oriented MBLJ (>12 m s−1) over the northern South China Sea at the 925 hPa level (Figure 40a) A SLLJ extends upward between 900–650 hPa around 25.3° N ahead of the frontal zone. Because this cross-section passing through the BJ (Figure 13), the SLLJ has merged with the BJ at low levels with a jet core greater than 14 m s−1 at approximately the 925 hPa level. On the eastern side, in the cross section along 124° E, the orographically enhanced wind maximum greater than 11 m s−1 in the boundary layer is evident around 23.5° N. A SLLJ extends upward around 27.5° N, above the sloping frontal surface (Figure 40b). An upper-level jet core greater than 35 m s−1 is also present. For heavy rainfall events over Taiwan, the MBLJ brings in moisture, whereas the secondary circulation associated with the jet/front system provides the large-scale lifting mechanism and possible upper-level dynamic forcing aloft. Over northern Taiwan, interactions of the jet/front system with terrain and rain evaporative cooling are important in determining the timing and distribution of localized rainfall.

6. Summary

All Mei-Yu fronts over southern China and Taiwan during the early summer rainy season are baroclinic in nature due to the intrusion of cold air from the mid-latitudes. They exhibit appreciable temperature and moisture gradients across the frontal zone in the lower troposphere. In the upper troposphere, there is tropopause folding and an upper-level jet. The Mei-Yu front exhibits a marked vertical tilt with a thermally direct circulation across the frontal zone, driven by a moist baroclinic process. Warm air rises within the pre-frontal southwesterly flow and cold air sinks in the postfrontal northeasterlies. The baroclinic conversion is enhanced by latent heat release, especially in the upper troposphere. The SLLJ is caused by the Coriolis force acting on the lower branch of the secondary circulation across the frontal zone and has a wind speed maximum in the 900–700 hPa layer ahead of the surface front. A weak thermally indirect circulation is observed south of the frontal zone. The rising motion associated with the secondary circulations across the jet/front systems brings the warm, moist, high equivalent potential temperature air upward along the sloping frontal zone and provides the lifting mechanism for the development of precipitation in the frontal zone.
The MBLJ is distinctly different from the SLLJ associated with the Mei-Yu frontal systems. The MBLJ events over the northern South China Sea are more frequent during the second half of the monsoon rainy season over Taiwan (after 1 June) than in late May and have a wind speed maximum axis around the 925 hPa level. During MBLJ days, the Mei-Yu trough over southeastern China is deeper and the WPSH is stronger and/or extends further westward than in the climatological mean for the month of June. The MBLJs are mainly caused by sub-synoptic pressure gradients. At the jet core, the vertical wind profile resembles an Ekman spiral with a wind speed maximum near the top of the mixed layer. The horizontal moisture transport by the MBLJ from the northern South China Sea to the Taiwan area is a favorable condition for the occurrence of heavy rainfall over the Taiwan area.
Orographic blocking of a low-level MBLJ with a large southerly wind component, along with convergence between a MBLJ and the cold pool derived from rain evaporative cooling provide the localized lifting needed for the development of heavy rainfall over the southwestern Taiwan coastal area. In the prefrontal atmosphere, in addition to horizontal advection, the low-level warm, moist air is advected vertically upward by the secondary circulation associated with the SLLJ. When an elevated SLLJ at the 850 hPa level has a large impinging angle, orographic lifting of the prefrontal warm, moist potentially unstable air on the windward slopes results in the localized heavy rainfall on the southwestern slopes of the Central Mountain Range and the Snow Mountains.
When a MBLJ or SLLJ is present, a BJ greater than 14 m s−1 around the 925 hPa level is observed off the northwestern coast of Taiwan, with a windward ridge/leeside trough pressure pattern, as a result of island blocking. The orographically induced pressure is highest over southwestern Taiwan, with upstream flow deceleration and splitting off the southwestern coast. The northern branch of the splitting airflow off the southwestern coast accelerates downstream of the windward pressure ridge. Above the top of the mixed layer at approximately 1 km, Lagrangian acceleration along the west coast is mainly caused by the pressure gradient term. In the mixed layer, there is a three-way balance among inertial acceleration, pressure gradient force, and frictional force. Because of the friction retardation, the BJ has a speed maximum at the top of the mixed layer with a composite speed maximum greater than 14 m s−1. The BJ enhances the horizontal moisture transport toward the frontal zone along the western/northwestern Taiwan coast.
As the Mei-Yu jet/front system moves toward the Taiwan area, the depth of the postfrontal cold air decreases due to a decrease in the Coriolis parameter, becoming rather shallow with a depth approximately ~1 km over Taiwan. Over northern Taiwan and the northwestern Taiwan coast, orographic effects on the landfalling jet/front system are important for the timing and location of localized heavy precipitation, including: orographic lifting of the postfrontal northerly wind component by the Yang-Ming Mountains along the northern Taiwan coast, enhanced frontal convergence due to the BJ along the northwestern coast, and orographic lifting of the postfrontal northwesterly flow on the northwestern slopes of the Snow Mountains. All three types of LLJs could possibly co-exist during the arrival of a Mei-Yu frontal system over northern Taiwan, especially in June when the southwesterly monsoon is well established. The MBLJ brings in the moisture, the secondary circulation associated with the jet/front system provides the large-scale lifting, and orographic and local effects (including rain evaporative cooling) provide localized convergence and lifting for heavy precipitation events.
For a relatively shallow (<1 km) east–west oriented front, such as the one that occurred 1–2 June 2017, with a depth below the Yang-Ming Mountain range with peaks of approximately 1120 m, the leading edge of the postfrontal northeasterly flow is anchored along the northern coastal slopes with a rainfall maximum along the northern coast. As the depth of the postfrontal cold northeasterlies gradually increases due to cold advection and the southward advancement of the sloping frontal zone, the postfrontal cold air eventually moves over the Yang-Ming Mountains. A rainfall maximum develops over the Taipei Basin due to frontal convergence. Another rainfall maximum occurs over the northwestern coast where the BJ converges with the postfrontal flow. As the front continues to advance southward, orographic precipitation is present on the northwestern slopes of the Snow Mountains caused by orographic lifting of the postfrontal flow.
In the case of an east–west oriented Mei-Yu front, the postfrontal cold air is more than 1.5 km deep, due to continued cold advection from the northern China plain to southern China by the northerly winds west of a Northeastern China low pressure center stalled by a mid-latitude omega blocking pattern, followed by the northerly winds west of a Mei-Yu frontal cyclone over southern China, such as the event that took place in the 11–12 June 2012 case. This type moves over the mountain range along the northern Taiwan coast without significant rainfall along the northern coast. A rainfall maximum, however, occurs along the northwestern coast due to convergence between the BJ and the postfrontal flow. Another maximum appears over the Taipei Basin due to frontal convergence.
For a NE–SW oriented front, such as the case that occurred on 24–25 June 1987, the convergence between the barrier jet and the southwesterly flow, or a wind shift line ahead of the Mei-Yu front, or the frontal boundary within the northern Taiwan Strait, is favorable for the development of deep convection under collaborating favorable large-scale settings, leading to heavy rainfall events along the western/northwestern Taiwan coast. The convection could also be enhanced along the leading edge of the cold pool caused by rain evaporative cooling. Under favorable large-scale conditions, rainfall production on the southwestern windward slopes of the Snow Mountains, Central Mountain Range, and southwestern Taiwan is related to the impinging angle and speed of the prefrontal SLLJ/MBLJ and local circulations. More cases are needed to study the multi-scale processes that control the timing and location of heavy rainfall over the Taiwan area.

Author Contributions

Conceptualization, Y.-L.C. and C.-C.T.; writing—original draft preparation, Y.-L.C.; visualization, C.-C.T. and F.H.; involved in the investigation, Y.-L.C., C.-C.T., F.H., C.-S.C., P.-L.L. and P.-H.L. All authors have read and agreed to the published version of the manuscript.

Funding

This research received no external funding.

Acknowledgments

This work is jointly funded by the National Science Foundation under Grants AGS-1142558 and AGS-1854443 to the University of Hawai‘i at Mānoa; and by the Ministry of Science and Technology (MOST) under Grants MOST 104-2923-M-008-003-MY5, MOST 109-2111-M-008-017, and MOST 110-2111-M-008-021, and the Featured Areas Research Center Program within the framework of the Higher Education Sprout Project by the Ministry of Education (MOE) to the National Central University. We thank two anonymous reviewers for their comments, and May Izumi, David Hitzl, and Rachael Eichelberger-Iga for editing the text. This is SOEST Contribution number 11478.

Conflicts of Interest

The authors declare no conflict of interest.

References

  1. Ninomiya, J.; Murakami, T. The Early Summer Rainy Season (Baiu) over Japan; Monsoon Meteorology; Chang, C.-P., Krisnamurti, T.N., Eds.; Oxford University Press: Oxford, UK, 1987; pp. 93–121. [Google Scholar]
  2. Lee, J.-Y.; Kwon, M.; Yun, K.-S.; Min, S.-K.; Park, I.-H.; Ham, Y.-G.; Lin, E.K.; Kim, J.-H.; Seo, K.-H.; Kim, W.; et al. The long-term variability of Changma in the East Asian summer monsoon system: A review and revisit. Asia Pac. J. Atmos. Sci. 2017, 53, 257–272. [Google Scholar] [CrossRef]
  3. Tao, S.; Chen, L. A Review of Recent Research on the East Asia Summer Monsoon in China; Monsoon Meteorology; Chang, C.-P., Krisnamurti, T.N., Eds.; Oxford University Press: Oxford, UK, 1987; pp. 60–92. [Google Scholar]
  4. Chen, G.T.-J. Observational aspects of the Mei-Yu phenomenon in subtropical China. J. Meteorol. Soc. Jpn. 1983, 61, 306–312. [Google Scholar] [CrossRef] [Green Version]
  5. Chen, Y.L.; Zhang, Y.-X.; Hui, N.B.-F. Analysis of a surface front during the early summer rainy season Over Tai-wan. Mon. Weather Rev. 1989, 117, 909–931. [Google Scholar] [CrossRef] [Green Version]
  6. Chen, C.-S.; Chen, Y.-L. The rainfall characteristics of Taiwan. Mon. Weather Rev. 2003, 131, 1323–1341. [Google Scholar] [CrossRef]
  7. Chen, C.-S.; Chen, Y.-L.; Liu, C.-L.; Lin, P.-L.; Chen, W.-C. Statistics of heavy rainfall occurrences in Taiwan. Weather Forecast. 2007, 22, 981–1002. [Google Scholar] [CrossRef]
  8. Kerns, B.W.J.; Chen, Y.-L.; Chang, M.-Y. The diurnal cycle of winds, rain, and clouds over Taiwan during the Mei-Yu, Summer, and Autumn rainfall regimes. Mon. Weather Rev. 2010, 138, 497–516. [Google Scholar] [CrossRef]
  9. Ogura, Y.; Asai, T.; Dohi, K. A case study of a heavy precipitation event along the Baiu front in Northern Kyushu, 23 July 1982: Nagasaki heavy rainfall. J. Meteorol. Soc. Jpn. 1985, 63, 883–900. [Google Scholar] [CrossRef] [Green Version]
  10. Akaeda, K.; Reisner, J.; Parsons, D. The Role of mesoscale and topographically induced circulations in initiating a flash Flood Observed during the TAMEX Project. Mon. Weather Rev. 1995, 123, 1720–1739. [Google Scholar] [CrossRef]
  11. Buzzi, A.; Tartaglione, N.; Malguzzi, P. Numerical simulations of the 1994 Piedmont Flood: Role of orography and moist processes. Mon. Weather Rev. 1998, 126, 2369–2383. [Google Scholar] [CrossRef]
  12. Zhu, Y.; Newell, R.E. A proposed algorithm for moisture fluxes from atmospheric rivers. Mon. Weather Rev. 1998, 126, 725–735. [Google Scholar] [CrossRef]
  13. Teng, J.-H.; Chen, C.-S.; Wang, T.-C.C.; Chen, Y.-L. Orographic effects on a squall line system over Taiwan. Mon. Weather Rev. 2000, 128, 1123–1138. [Google Scholar] [CrossRef]
  14. Garvert, M.F.; Colle, B.A.; Mass, C.F. The 13–14 December 2001 IMPROVE-2 Event. Part I: Synoptic and mesoscale evolution and comparison with a mesoscale model simulation. J. Atmos. Sci. 2005, 62, 3474–3492. [Google Scholar] [CrossRef]
  15. Lin, Y.-L.; Chiao, S.; Wang, T.-A.; Kaplan, M.L.; Weglarz, R.P. Some Common Ingredients for Heavy Orographic Rainfall. Weather Forecast. 2001, 16, 633–660. [Google Scholar] [CrossRef]
  16. Medina, S.; Smull, B.F.; Houze, R.A.; Steiner, M. Cross-Barrier Flow during Orographic Precipitation Events: Results from MAP and IMPROVE. J. Atmos. Sci. 2005, 62, 3580–3598. [Google Scholar] [CrossRef] [Green Version]
  17. Bougeault, P.; Binder, P.; Buzzi, A.; Dirks, R.; Kuettner, J.; Houze, R.; Smith, R.B.; Steinacker, R.; Volkert, H. The MAP Special Observing Period. Bull. Am. Meteorol. Soc. 2001, 82, 433–462. [Google Scholar] [CrossRef] [Green Version]
  18. Witcraft, N.C.; Lin, Y.-L.; Kuo, Y.-H. Dynamics of orographic rain associated with the passage of a tropical cyclone over a mesoscale mountain. Terr. Atmos. Ocean. Sci. 2005, 16, 1133–1161. [Google Scholar] [CrossRef] [Green Version]
  19. Schroeder, T.A. Meteorological analysis of an Oahu flood. Mon. Weather Rev. 1977, 105, 458–468. [Google Scholar] [CrossRef] [Green Version]
  20. Kodama, K.; Barnes, G.M. Heavy rain events over the south-facing slopes of Hawaii: Attendant conditions. Weather Forecast. 1997, 12, 347–367. [Google Scholar] [CrossRef]
  21. Tu, C.-C.; Chen, Y.-L. Favorable conditions for the development of a heavy rainfall event over Oahu during the 2006 wet period. Weather Forecast. 2011, 26, 280–300. [Google Scholar] [CrossRef]
  22. Jayawardena, I.M.S.; Chen, Y.-L.; Nash, A.J.; Kodama, K. A comparison of three prolonged periods of heavy rainfall over the Hawaiian Islands. J. Appl. Meteorol. Clim. 2012, 51, 722–744. [Google Scholar] [CrossRef]
  23. Parish, T.R. On the forcing of the summertime Great Plains Low-Level jet. J. Atmos. Sci. 2017, 74, 3937–3953. [Google Scholar] [CrossRef]
  24. Browning, K.A.; Pardoe, C.W. Structure of low-level jet streams ahead of mid-latitude cold fronts. Q. J. R. Meteorol. Soc. 1973, 99, 619–638. [Google Scholar] [CrossRef]
  25. Kotroni, V.; Lagouvardos, K. Low-level jet streams associated with atmospheric cold fronts: Seven case studies from the Fronts 87 Experiment. Geophys. Res. Lett. 1993, 20, 1371–1374. [Google Scholar] [CrossRef]
  26. Lavers, D.A.; Villarini, G.; Allan, R.; Wood, E.; Wade, A. The detection of atmospheric rivers in atmospheric reanalyses and their links to British winter floods and the large-scale climatic circulation. J. Geophys. Res. Earth Surf. 2012, 117, D20106. [Google Scholar] [CrossRef]
  27. Akiyama, T. Ageostrophic low-level jet stream in the Baiu season associated with heavy rainfalls over the sea area. J. Meteorol. Soc. Jpn. 1973, 51, 205–208. [Google Scholar] [CrossRef] [Green Version]
  28. Chen, G.T.-J.; Yu, C.-C. Study of low-level jet and extremely heavy rainfall over Northern Taiwan in the Mei-Yu season. Mon. Weather Rev. 1988, 116, 884–891. [Google Scholar] [CrossRef] [Green Version]
  29. Tsay, C.-Y. The coupling of upper-level and low-level jet streaks during TAMEX period. Atmos. Sci. 1991, 19, 67–87, (In Chinese with English Abstract). [Google Scholar]
  30. Nagata, M.; Ogura, Y. A modeling case study of interaction between heavy precipitation and a low-level jet over Japan in the Baiu season. Mon. Weather Rev. 1991, 119, 1309–1336. [Google Scholar] [CrossRef]
  31. Chen, G.T.-J.; Wang, C.-C.; Lin, D.T.-W. Characteristics of low-level jets over Northern Taiwan in Mei-Yu season and their relationship to heavy rain events. Mon. Weather Rev. 2005, 133, 20–43. [Google Scholar] [CrossRef] [Green Version]
  32. Chen, Y.-L.; Chen, X.-A.; Zhang, Y.-X. A diagnostic study of the low-level jet (LLJ) during TAMEX IOP 5. Mon. Weather Rev. 1994, 122, 2257–2284. [Google Scholar] [CrossRef] [Green Version]
  33. Chen, Y.-L.; Chen, X.A.; Chen, S.; Kuo, Y.-H. A numerical study of the low-level jet during TAMEX IOP 5. Mon. Weather Rev. 1997, 125, 2583–2604. [Google Scholar] [CrossRef]
  34. Shin, C.-S.; Lee, T.-Y. Development mechanisms for the heavy rainfalls of 6–7 August 2002 over the middle of the Korean Peninsula. J. Meteorol. Soc. Jpn. 2005, 83, 683–709. [Google Scholar] [CrossRef] [Green Version]
  35. Pham, N.T.; Nakamura, K.; Furuzawa, F.A.; Satoh, S. Characteristics of low-level jets over Okinawa in the Baiu and post-Baiu seasons revealed by wind profiler observations. J. Meteorol. Soc. Jpn. 2008, 86, 699–717. [Google Scholar] [CrossRef] [Green Version]
  36. Chen, R.; Tomassini, L. The role of moisture in summertime low-level jet formation and associated rainfall over the East Asian monsoon region. J. Atmos. Sci. 2015, 72, 3871–3890. [Google Scholar] [CrossRef]
  37. Liu, X.; Luo, Y.; Huang, L.; Zhang, D.; Guan, Z. Roles of double low-level jets in the generation of coexisting inland and coastal heavy rainfall over South China during the presummer rainy season. J. Geophys. Res. Atmos. 2020, 125, e2020JD032890. [Google Scholar] [CrossRef]
  38. Park, C.; Son, S.-W.; Kim, J.-H. Role of baroclinic trough in triggering vertical motion during summertime heavy rainfall events in Korea. J. Atmos. Sci. 2021, 78, 1687–1702. [Google Scholar] [CrossRef]
  39. Cook, K.H.; Vizy, E.K. Hydrodynamics of the Caribbean low-level jet and its relationship to precipitation. J. Clim. 2010, 23, 1477–1494. [Google Scholar] [CrossRef]
  40. Muñoz, E.; Busalacchi, A.J.; Nigam, S.; Ruiz-Barradas, A. winter and summer structure of the Caribbean low-level jet. J. Clim. 2008, 21, 1260–1276. [Google Scholar] [CrossRef]
  41. Uccellini, L.W.; Petersen, R.A.; Kocin, P.J.; Brill, K.F.; Tuccillo, J.J. Synergistic interactions between an upper-level jet streak and diabatic processes that influence the development of a low-level jet and a secondary coastal cyclone. Mon. Weather Rev. 1987, 115, 2227–2261. [Google Scholar] [CrossRef] [Green Version]
  42. Doyle, J.D.; Warner, T.T. A three-dimensional investigation of a Carolina low-level jet during GALE IOP 2. Mon. Weather Rev. 1993, 121, 1030–1047. [Google Scholar] [CrossRef]
  43. Ralph, F.M.; Neiman, P.J.; Wick, G.A. Satellite and CALJET aircraft observations of atmospheric rivers over the eastern North Pacific Ocean during the winter of 1997/98. Mon. Weather Rev. 2004, 132, 1721–1745. [Google Scholar] [CrossRef] [Green Version]
  44. Neiman, P.J.; Ralph, F.M.; Wick, G.A.; Kuo, Y.-H.; Wee, T.-K.; Ma, Z.; Taylor, G.H.; Dettinger, M.D. Diagnosis of an intense atmospheric river impacting the Pacific Northwest: Storm summary and offshore vertical structure observed with COSMIC satellite retrievals. Mon. Weather Rev. 2008, 136, 4398–4420. [Google Scholar] [CrossRef] [Green Version]
  45. Holton, J.R. The diurnal boundary layer wind oscillation above sloping terrain. Tellus 1967, 19, 199–205. [Google Scholar] [CrossRef]
  46. Bonner, W.D. Climatology of the low-level jet. Mon. Weather Rev. 1968, 96, 833–850. [Google Scholar] [CrossRef] [Green Version]
  47. Uccellini, L.W. On the role of upper tropospheric jet streaks and leeside cyclogenesis in the development of low-level jets in the Great Plains. Mon. Weather Rev. 1980, 108, 1689–1696. [Google Scholar] [CrossRef] [Green Version]
  48. Pu, B.; Dickinson, R.E. Diurnal spatial variability of Great Plains summer precipitation related to the dynamics of the low-level jet. J. Atmos. Sci. 2014, 71, 1807–1817. [Google Scholar] [CrossRef]
  49. Du, Y.; Rotunno, R. A Simple analytical model of the nocturnal low-level jet over the Great Plains of the United States. J. Atmos. Sci. 2014, 71, 3674–3683. [Google Scholar] [CrossRef]
  50. Garreaud, R.; Muñoz, R. The low-level jet off the west coast of subtropical South America: Structure and variability. Mon. Weather Rev. 2005, 133, 2246–2261. [Google Scholar] [CrossRef] [Green Version]
  51. Salio, P.; Nicolini, M.; Zipser, E.J. Mesoscale convective systems over southeastern South America and their relationship with the South American low-level jet. Mon. Weather Rev. 2007, 135, 1290–1309. [Google Scholar] [CrossRef] [Green Version]
  52. Rasmussen, K.L.; Houze, R.A. Convective initiation near the Andes in subtropical South America. Mon. Weather Rev. 2016, 144, 2351–2374. [Google Scholar] [CrossRef]
  53. Du, Y.; Zhang, Q.; Chen, Y.-L.; Zhao, Y.; Wang, X. Numerical simulations of spatial distributions and diurnal variations of low-level jets in China during early summer. J. Clim. 2014, 27, 5747–5767. [Google Scholar] [CrossRef]
  54. Du, Y.; Chen, Y.-L.; Zhang, Q. Numerical Simulations of the Boundary Layer Jet off the Southeastern Coast of China. Mon. Weather Rev. 2015, 143, 1212–1231. [Google Scholar] [CrossRef]
  55. Du, Y.; Chen, G. Climatology of low-level jets and their impact on rainfall over southern China during the early-summer rainy season. J. Clim. 2019, 32, 8813–8833. [Google Scholar] [CrossRef]
  56. Chen, X.A.; Chen, Y.-L. Development of Low-Level Jets during TAMEX. Mon. Weather Rev. 1995, 123, 1695–1719. [Google Scholar] [CrossRef] [Green Version]
  57. Chen, Y.-L.; Tseng, S.-F. Comments on “The intensification of the low-level jet during the development of mesoscale convective systems on a Mei-Yu Front”. Mon. Weather Rev. 2000, 128, 495. [Google Scholar] [CrossRef]
  58. Tu, C.-C.; Chen, Y.-L.; Lin, P.-L.; Du, Y. Characteristics of the marine boundary layer jet over the South China Sea during the early summer rainy season of Taiwan. Mon. Weather Rev. 2019, 147, 457–475. [Google Scholar] [CrossRef]
  59. Tu, C.-C.; Chen, Y.-L.; Lin, P.-L.; Lin, P.-H. The relationship between the boundary layer moisture transport from the South China Sea and heavy rainfall over Taiwan. Terr. Atmos. Ocean. Sci. 2020, 31, 159–176. [Google Scholar] [CrossRef]
  60. Tu, C.-C.; Chen, Y.-L.; Lin, P.-L.; Huang, M.-Q. Analysis and Simulations of a heavy rainfall event associated with the passage of a shallow front over Northern Taiwan on 2 June 2017. Mon. Weather Rev. 2022, 150, 505–528. [Google Scholar] [CrossRef]
  61. Chen, Y.-L.; Li, J. Large-Scale conditions favorable for the development of heavy rainfall during TAMEX IOP 3. Mon. Weather Rev. 1995, 123, 2978–3002. [Google Scholar] [CrossRef] [Green Version]
  62. Li, J.; Chen, Y.-L.; Lee, W.-C. Analysis of a heavy rainfall event during TAMEX. Mon. Weather Rev. 1997, 125, 1060–1082. [Google Scholar] [CrossRef]
  63. Li, J.; Chen, Y.-L. Barrier jets during TAMEX. Mon. Weather Rev. 1998, 126, 959–971. [Google Scholar] [CrossRef]
  64. Yeh, H.-C.; Chen, Y.-L. The role of offshore convergence on coastal rainfall during TAMEX IOP 3. Mon. Weather Rev. 2002, 130, 2709–2730. [Google Scholar] [CrossRef]
  65. Yeh, H.-C.; Chen, Y.-L. Numerical simulation of the barrier jet over northwestern Taiwan during the Mei-Yu season. Mon. Weather Rev. 2003, 131, 1396–1407. [Google Scholar] [CrossRef]
  66. Yeh, H.-C.; Chen, Y.-L. Characteristics of rainfall distributions over Taiwan during Taiwan Area Mesoscale Experiment (TAMEX). J. Appl. Meteor. Climatol. 1998, 37, 1457–1469. [Google Scholar] [CrossRef]
  67. Kuo, Y.-H.; Chen, G.T.-J. The Taiwan area mesoscale experiments: An overview. Bull. Amer. Meteor. Soc. 1990, 71, 488–503. [Google Scholar] [CrossRef] [Green Version]
  68. Ciesielski, P.E.; Chang, W.-M.; Huang, S.-C.; Johnson, R.H.; Jou, B.J.-D.; Lee, W.-C.; Lin, P.-H.; Liu, C.-H.; Wang, J. Quality-controlled upper-air sounding dataset for TiMREX/SoWMEX: Development and corrections. J. Atmos. Ocean. Technol. 2010, 27, 1802–1821. [Google Scholar] [CrossRef]
  69. Xu, W.; Zipser, E.J.; Chen, Y.-L.; Liu, C.; Liou, Y.-C.; Lee, W.-C.; Jou, B.J.D. An orography-associated extreme rainfall event during TiMREX: Initiation, storm evolution, and maintenance. Mon. Weather Rev. 2012, 140, 2555–2574. [Google Scholar] [CrossRef] [Green Version]
  70. Tu, C.-C.; Chen, Y.-L.; Chen, C.-S.; Lin, P.-L.; Lin, P.-H. A comparison of two heavy rainfall events during the Terrain-Influenced Monsoon Rainfall Experiment (TiMREX) 2008. Mon. Weather Rev. 2014, 142, 2436–2463. [Google Scholar] [CrossRef]
  71. Wang, C.-C.; Hsu, J.C.-S.; Chen, G.T.-J.; Lee, D.-I. A study of two propagating heavy-rainfall episodes near Taiwan during SoWMEX/TiMREX IOP-8 in June 2008. Part I: Synoptic evolution, episode propagation, and model control simulation. Mon. Weather. Rev. 2014, 142, 2619–2643. [Google Scholar] [CrossRef]
  72. Chen, Y.-L.; Hui, N.B.-F. Analysis of a shallow front during TAMEX. Mon. Weather Rev. 1990, 118, 2607–2623. [Google Scholar] [CrossRef] [Green Version]
  73. Chen, Y.-L.; Hui, N.B.-F. Analysis of a relatively dry front during the Taiwan Area Mesoscale Experiment. Mon. Weather Rev. 1992, 120, 2442–2468. [Google Scholar] [CrossRef] [Green Version]
  74. Trier, S.B.; Parsons, D.B.; Matejka, T.J. Observations of a subtropical cold front in a region of complex terrain. Mon. Weather Rev. 1990, 118, 2449–2470. [Google Scholar] [CrossRef]
  75. Chen, Y.-L. Some synoptic-scale aspects of the surface fronts over southern China during TAMEX. Mon. Weather Rev. 1993, 121, 50–64. [Google Scholar] [CrossRef] [Green Version]
  76. Chen, C.-Y.; Chen, Y.-L.; Chen, C.-S.; Lin, P.-L.; Liu, C.-L. Revisiting the heavy rainfall event over Northern Taiwan on 3 June 1984. Terr. Atmos. Ocean. Sci. 2013, 24, 999. [Google Scholar] [CrossRef] [Green Version]
  77. Chen, Y.-L.; Chu, Y.-J.; Chen, C.-S.; Tu, C.-C.; Teng, J.-H.; Lin, P.-L. Analysis and simulations of a heavy rainfall event over Northern Taiwan during 11–12 June 2012. Mon. Weather Rev. 2018, 146, 2697–2715. [Google Scholar] [CrossRef]
  78. Chou, L.C.; Chang, C.-P.; Williams, R.T. A numerical simulation of the Mei-Yu Front and the associated low-level jet. Mon. Weather Rev. 1990, 118, 1408–1428. [Google Scholar] [CrossRef] [Green Version]
  79. Hsu, W.-R.; Sun, W.-Y. A numerical study of a low-level jet and its accompanying secondary circulation in a Mei-Yu system. Mon. Weather Rev. 1994, 122, 324–340. [Google Scholar] [CrossRef] [Green Version]
  80. Chen, X.A.; Chen, Y.-L. Kinetic energy budgets of the low-level jet during TAMEX IOP 5. J. Meteorol. Soc. Jpn. 2002, 80, 1–19. [Google Scholar] [CrossRef] [Green Version]
  81. Chen, G.T.-J.; Chang, C.-P. The structure and vorticity budget of an early summer monsoon trough (Mei-Yu) over southeastern China and Japan. Mon. Weather Rev. 1980, 108, 942–953. [Google Scholar] [CrossRef] [Green Version]
  82. Hsiao, F.; Chen, Y.-L. Revisiting the structure and characteristics of an early summer monsoon trough over South China in 1975. SOLA 2014, 10, 194–198. [Google Scholar] [CrossRef] [Green Version]
  83. Du, Y.; Chen, G.; Han, B.; Mai, C.; Bai, L.; Li, M. Convection initiation and growth at the coast of South China. Part I: Effect of the Marine Boundary-Layer Jet. Mon. Weather Rev. 2020, 148, 3847–3869. [Google Scholar] [CrossRef]
  84. Du, Y.; Chen, G. Heavy Rainfall Associated with Double Low-Level Jets over Southern China. Part II: Convection Initiation. Mon. Weather Rev. 2019, 147, 543–565. [Google Scholar] [CrossRef]
  85. Zhang, M.; Meng, Z. Warm-sector heavy rainfall in southern China and its WRF simulation evaluation: A low-level-jet perspective. Mon. Weather Rev. 2019, 147, 4461–4480. [Google Scholar] [CrossRef]
  86. Li, X.; Du, Y. Statistical Relationships between Two Types of Heavy Rainfall and Low-Level Jets in South China. J. Clim. 2021, 34, 8549–8566. [Google Scholar] [CrossRef]
  87. Saha, S.; Moorthi, S.; Pan, H.-L.; Wu, X.; Wang, J.; Nadiga, S.; Tripp, P.; Kistler, R.; Woollen, J.; Behringer, D.; et al. NCEP Climate Forecast System Reanalysis (CFSR) selected hourly time-series products, January 1979 to December 2010. Bull. Am. Meteorol. Soc. 2010, 91, 1015–1058. [Google Scholar] [CrossRef]
  88. Alpert, J.C. Sub-grid scale mountain blocking at NCEP. In Proceedings of the 20th Conference on Weather and Forecasting, Seattle, WA, USA, 13 January 2004; Available online: https://ams.confex.com/ams/pdfpapers/71011.pdf (accessed on 24 January 2022).
  89. Lott, F.; Miller, M.J. A new subgrid-scale orographic drag parametrization: Its formulation and testing. Q. J. R. Meteorol. Soc. 1997, 123, 101–127. [Google Scholar] [CrossRef]
  90. Tu, C.-C.; Chen, Y.-L.; Chen, S.-Y.; Kuo, Y.-H.; Lin, P.-L. Impacts of including rain-evaporative cooling in the initial conditions on the Prediction of a coastal heavy rainfall event during TiMREX. Mon. Weather Rev. 2017, 145, 253–277. [Google Scholar] [CrossRef] [Green Version]
  91. Chen, C.-S.; Chen, W.-C.; Chen, Y.-L.; Lin, P.-L.; Lai, H.-C. Investigation of orographic effects on two heavy rainfall events over southwestern Taiwan during the Mei-yu season. Atmos. Res. 2005, 73, 101–130. [Google Scholar] [CrossRef]
  92. Moncrieff, M.W.; Waliser, D.E.; Miller, M.J.; Shapiro, M.A.; Asrar, G.R.; Caughey, J. Multiscale convective organization and the YOTC virtual global field campaign. Bull. Am. Meteorol. Soc. 2012, 93, 1171–1187. [Google Scholar] [CrossRef]
  93. Chen, C.-S.; Lin, Y.-L.; Hsu, N.-N.; Liu, C.-L.; Chen, C.-Y. Orographic effects on localized heavy rainfall events over southwestern Taiwan on 27 and 28 June 2008 during the post-Mei-Yu period. Atmos. Res. 2011, 101, 595–610. [Google Scholar] [CrossRef]
  94. Zhang, M.; Rasmussen, K.L.; Meng, Z.; Huang, Y. Impacts of Coastal Terrain on Warm-Sector Heavy-Rain-Producing MCSs in Southern China. Mon. Weather Rev. 2022; in press. [Google Scholar] [CrossRef]
  95. Colle, B.A.; Novak, D.R. The New York bight jet: Climatology and dynamical evolution. Mon. Weather Rev. 2010, 138, 2385–2404. [Google Scholar] [CrossRef]
  96. Pomeroy, K.R.; Parish, T.R. A case study of the interaction of the summertime coastal jet with the California topography. Mon. Weather Rev. 2001, 129, 530–539. [Google Scholar] [CrossRef]
  97. Muñoz, R.C.; Garreaud, R. Dynamics of the low-level jet off the west coast of subtropical South America. Mon. Weather Rev. 2005, 133, 3661–3677. [Google Scholar] [CrossRef]
  98. Jiang, Q.; Wang, S.; O’Neill, L. Some insights into the characteristics and dynamics of the Chilean low-level coastal jet. Mon. Weather Rev. 2010, 138, 3185–3206. [Google Scholar] [CrossRef] [Green Version]
  99. Lin, P.-L.; Chen, Y.-L.; Chen, C.-S.; Liu, C.-L. Numerical experiments investigating the orographic effects on a heavy rainfall event over the northwestern coast of Taiwan during TAMEX IOP 13. Arch. Meteorol. Geophys. Bioclimatol. Ser. B 2011, 114, 35–50. [Google Scholar] [CrossRef] [Green Version]
  100. Chen, Y.-L.; Li, J. Characteristics of surface airflow and pressure patterns over the island of Taiwan during TAMEX. Mon. Weather Rev. 1995, 123, 695–716. [Google Scholar] [CrossRef] [Green Version]
  101. Ke, C.-Y.; Chung, K.-S.; Wang, T.-C.C.; Liou, Y.-C. Analysis of heavy rainfall and barrier-jet evolution during Mei-Yu season using multiple Doppler radar retrievals: A case study on 11 June 2012. Tellus A Dyn. Meteorol. Oceanogr. 2019, 71, 1571369. [Google Scholar] [CrossRef] [Green Version]
  102. Chiou, T.K.; Liu, F.C. A mesoscale analysis of heavy rainfall on 3 June 1984 and the discussion of flash floods in northern Taiwan. Meteorol. Bull. 1985, 31, 1–14, (In Chinese with English Abstract). [Google Scholar]
Figure 1. The 2008–12 (a) composite of rain rates (mm h−1; shaded) for the MBLJ days and (b) June monthly mean from rain gauge observations. (c) The ratio of composite rain rates for the MBLJ days to the June monthly mean rain rates (%) [(a)/(b)]. (d) Terrain height (m) over Taiwan. See Figure 9 in Ref. [58]. Copyright 2019 American Meteorological Society.
Meteorology 01 00006 g001
Figure 2. North-south cross sections along 118° E for 0000 UTC 27 May 1987: (a) potential temperature (solid) every 5 K; water vapor mixing ratio (dashed) every 2 g kg−1 and winds in m s−1 with one pennant, full barb, and half barb denoting 25, 5, and 2.5 m s−1, respectively. (b) Equivalent potential temperature (solid) every 5 K and relative humidity (dashed) every 20%. See Figure 9 in Ref. [5]. Copyright 1989 American Meteorological Society.
Meteorology 01 00006 g002
Figure 3. Latitude-time section along 120° E for the 850 hPa level. Potential temperature (solid) every 5 K: (A) 10–31 May; (B) 1–27 June 1987. An arrow marks the passage of the surface front over northern Taiwan. See Figure 9 in Ref. [75]. Copyright 1993 American Meteorological Society.
Meteorology 01 00006 g003
Figure 4. (a) Horizontal view of the flight track for 15 June 1987. East of Taiwan, six-level north-south flight legs were made between points A and B. West of Taiwan, the sawtooth pattern was performed between points C and D. (b) The relative airflow in the north-south cross section across the front east of Taiwan. The estimated frontal speed, 6 m s−1, was subtracted from the cross-front wind component. See Figure 2 and Figure 19 in Ref. [72]. Copyright 1990 American Meteorological Society.
Meteorology 01 00006 g004
Figure 5. Simulated geopotential height and wind field in CTRL at the 24 h forecast time (valid at 0000 UTC 1 June). Winds (m s−1) with one pennant, full barb, and half-barb denoting 25, 5, and 2.5 m s−1, respectively: (a) 700 hPa, geopotential heights (solid) every 30 m; (b) 700 hPa, isotach every 2.5 m s−1 starting from 12.5 m s−1; (c) as in (a) except for 250 hPa with geopotential heights every 120 m; and (d) 250 hPa with isotach every 5 m s−1 starting from 30 m s−1. See Figure 4 in Ref. [33]. Copyright 1997 American Meteorological Society.
Meteorology 01 00006 g005
Figure 6. Schematic delineating the secondary circulations across the jet/front system. The thin solid line depicts the strong direct (D) circulation. The thin dashed line depicts the weak indirect (I) circulation. The heavy solid line shows the low-level frontal position. The “J” indicates the upper-level and low-level jet positions. The double thin line shows the position of the tropopause. Regions with relative humidity greater than 70% are shaded. See Figure 22 in Ref. [32]. Copyright 1994 American Meteorological Society.
Meteorology 01 00006 g006
Figure 7. Area-averaged (over an area covering the entire frontal cyclone) (Figure 5b) vertical distribution of baroclinic conversion term −ωα at the 24 h forecast time (valid at 0000 UTC 1 June) (ω is p-velocity, α is specific volume). See Figure 21 in Ref. [33]. Copyright 1997 American Meteorological Society.
Meteorology 01 00006 g007
Figure 8. The 300 hPa ERA-40 analysis of geopotential height (gpm, solid contours) and horizontal wind (m s−1, wind barbs) at: (a) 1200 UTC 9 June, (b) 0000 UTC 10 June, (c) 1200 UTC 12 June, and (d) 0000 UTC 14 June. Contour intervals every 80 gpm for geopotential height. Full (half) wind barbs indicate 10 (5) m s−1. The symbol H (L) marks the locations of high (low) pressure centers. Thick dashed lines represent troughs. See Figure 1 in Ref. [82].
Meteorology 01 00006 g008
Figure 9. The latitude-time cross section at 115° E. Full (half) wind barbs indicate 10 (5) m s−1. (a) 925 hPa. Solid contour intervals every 10 gpm for geopotential height; shading intervals every 2 K for potential temperature. Thick dashed lines represent a wind shift line associated with the trough. (b) 500 hPa. Solid (dotted) contour intervals every 0.1 Pa s−1 for rising (sinking) vertical motions; shading intervals every 2 K for equivalent potential temperature. (c) 500 hPa. Contour intervals every 10 gpm for geopotential height; shading intervals every 2 K for potential temperature. (d) 300 hPa. Isotach every 5 m s−1; equivalent potential temperature every 2 K. Figure 3 in Ref. [82].
Meteorology 01 00006 g009
Figure 10. (a) Daily (0000–2400 LST) rainfall accumulation (mm; color shaded) for 10 June. (b) As in (a), but for 11 June. (c) As in (a), but for 12 June. (d) Rainfall accumulation (mm) during 10–12 June. Terrain contours are 100 and 500 m. See Figure 6 in Ref. [77]. Copyright 2018 American Meteorological Society.
Meteorology 01 00006 g010
Figure 11. Synoptic fields from ERA-Interim (10°–60° N, 105°–170° E) at 1200 UTC 11 June. (a) The 500 hPa level geopotential heights every 50 m and winds (m s−1) (one pennant, full barb, and half barb represent 25, 5, and 2.5 m s−1, respectively). (b) As in (a), but for the 850 hPa level. Geopotential heights every 30 gpm, winds, and equivalent potential temperature every 3 K (color shaded). (c) As in (a), but for the 925 hPa level. (d) As in (a), but for sea level pressure (every 2 hPa), surface temperature (°C; color shaded), and surface winds. Figure 4 in Ref. [77]. Copyright 2018 American Meteorological Society.
Meteorology 01 00006 g011
Figure 12. Vertical cross-section along 119.5° E for 1200 UTC (2000 LST) 11 June. (a) Equivalent potential temperature (solid white lines; every 5 K), relative humidity (%; color shaded), and horizontal winds (m s−1; one pennant, full barb, and half barb represent 25, 5, and 2.5 m s−1, respectively). (b) Vertical motion (Pa s−1; <0 Pa s−1, contoured every 0.3 Pa s−1) and horizontal moisture flux (vectors with magnitude color shaded every 30 g kg−1 m s−1). Figure 5 in Ref. [77]. Copyright 2018 American Meteorological Society.
Meteorology 01 00006 g012
Figure 13. Terrain height every 200 m. The black box is the region selected for the MBLJ day definition. If more than 60% of the grid points in the black box satisfy the MBLJ criteria and the event persists for more than 6 h, that entire day (0000–2359 UTC) is defined as a MBLJ day. Blue dot marks Dongsha Island. See Figure 1 in Ref. [58]. Copyright 2019 American Meteorological Society.
Meteorology 01 00006 g013
Figure 14. The 2008–2012 CFSR (a) composite of the 925 hPa winds (V; m s−1) and geopotential height (gpm) for the MBLJ days. (b) June monthly mean 925 hPa winds (V; m s−1) and geopotential height (gpm). (c) The 925 hPa winds (V; m s−1) and geopotential height (gpm) differences between the MBLJ days and the June monthly mean (MBLJ days V−monthly mean V). (d) As in (a), but for the 700 hPa winds (V; m s−1) and geopotential height (gpm). Blue solid circle in (a) marks Dongsha Island. See Figure 2 in Ref. [58]. Copyright 2019 American Meteorological Society.
Meteorology 01 00006 g014
Figure 15. (a) The 2008–12 CFSR composite of the vertical cross section along 21° N for the MBLJ days (a) winds (V; m s−1) with wind barbs (full barb represents 5 m s−1), (b) geostrophic winds (Vg; m s−1) with wind barbs (full barb represents 5 m s−1), (c) ageostrophic winds (Va; m s−1) with wind barbs (full barb represents 5 m s−1), (d) equivalent potential temperature (K), and (e) horizontal moisture flux vector (g kg−1 m s−1). (f) As in (e), but for the June monthly mean. See Figure 5 in Ref. [58]. Copyright 2019 American Meteorological Society.
Meteorology 01 00006 g015
Figure 16. The hodograph at the jet core of the MBLJ (20.5° N, 116.5° E); the green curve is the hodograph from the 1000 to 900 hPa level. The thick black arrow shows the 900 hPa winds (V; m s−1). The thick blue arrow shows the 900 hPa geostrophic wind (Vg; m s−1). The thick red arrow shows the 900 hPa ageostrophic wind (Va; m s−1). See Figure 6 in Ref. [58]. Copyright 2019 American Meteorological Society.
Meteorology 01 00006 g016
Figure 17. Diurnal variations of the CFSR wind component parallel to the geostrophic flow (m s−1; red line), speed of the geostrophic flow (m s−1; blue line), ageostrophic wind component perpendicular to the geostrophic flow (m s−1; green line), and friction velocity (m s−1) for the MBLJ days over the boxed area (19°–22° N, 115°–119° E). See Figure 15 in Ref. [58]. Copyright 2019 American Meteorological Society.
Meteorology 01 00006 g017
Figure 18. The 2008–12 CFSR composite of the vertical cross section along 116.5° E for the MBLJ days. (a) Horizontal winds (V; m s−1) with wind barb (full barb represents 5 m s−1), (b) equivalent potential temperature (K), (c) horizontal moisture flux vector (qV; g kg−1 m s−1), and (d) vertical moisture flux (qw; g kg−1 m s−1). See Figure 10 in Ref. [58]. Copyright 2019 American Meteorological Society.
Meteorology 01 00006 g018
Figure 19. The 2008–12 CFSR composite of the vertical cross section along 116.5° E for the MBLJ days. (a) tendency term q ¯ / t (10−5 g kg−1 s−1); (b) horizontal moisture advection term ( V ¯ · q ¯ ) (10−5 g kg−1 s−1); (c) vertical moisture advection term [ ω ¯ q ¯ / p ] (10−5 g kg−1 s−1); and (d) subgrid-scale term [ c ¯ e ¯ + q ω ¯ / p ] (10−5 g kg−1 s−1). See Figure 11 in Ref. [58]. Copyright 2019 American Meteorological Society.
Meteorology 01 00006 g019
Figure 20. (a) The 2008–12 CFSR composite of the 925 hPa moisture flux convergence (10−4 g kg−1 s−1; shaded), geopotential height (gpm; contoured), and moisture flux (g kg−1 m s−1; vectors) for the MBLJ days. (b) As in (a), but for the June monthly mean. (c) The 2008–12 0.25° TRMM composite of rain rates (mm h−1; shaded) from the 3B42 dataset for the MBLJ days. (d) As in (c), but for the June monthly mean. See Figure 8 in Ref. [58]. Copyright 2019 American Meteorological Society.
Meteorology 01 00006 g020
Figure 21. The YOTC analysis averaged during 0000–1200 UTC 16 June: (a) TPW (mm) (shaded); (b) 900 hPa winds (m s−1) (a full barb represents 5 m s−1) and geopotential height (gpm) (contoured). See Figure 13e,f in Ref. [90]. Copyright 2017 American Meteorological Society.
Meteorology 01 00006 g021
Figure 22. (a) Total rainfall accumulation (mm) during 1600 UTC 15 June–0000 UTC 16 June from rain gauge observations. (b) As in (a), but for total rainfall accumulation (mm) during 0000–1000 UTC 16 June from rain gauge observations. (c,d) As in (a,b) but for model forecasts for domain 3 (3 km grids) of the data assimilation run (ALL_DATA run). See Figures 12a,c and 15a,c in Ref. [90]. Copyright 2017 American Meteorological Society.
Meteorology 01 00006 g022
Figure 23. The CFSR time series along the NW–SE line (purple line in Figure 13) from 0000 UTC 16 May to 0000 UTC 30 June 2017: (a) 925 hPa winds (m s−1); (b) 925 hPa geopotential height (gpm); (c) 925 hPa horizontal moisture flux vector (qV) (g kg−1 m s−1); and (d) 700 hPa horizontal moisture flux vector (qV) (g kg−1 m s−1). See Figure 2 in Ref. [59].
Meteorology 01 00006 g023
Figure 24. Time series of (a) averaged daily rainfall over Taiwan from rain gauges (mm), (b) number of stations recording heavy rain (>80 mm day−1), (c) number of stations recording extremely heavy rain (>200 mm day−1), (d) number of stations recording torrential rain (>350 mm day−1), and (e) number of stations recording extreme torrential rain (>500 mm day−1) from 16 May–30 June 2017 (LST). (f) A spatial map of rain gauges over Taiwan (512 total stations). See Figure 3 in Ref. [59].
Meteorology 01 00006 g024
Figure 25. (A) Subjectively analyzed synoptic-scale chart at 850 hPa for 1200 UTC 21 May 1987. Geopotential heights in (A) every 30 m; (B) Winds and D values at the 900 m level around 1500 UTC 21 May. D values every 3 m. Winds (m s−1) with one pennant, full barb, and half barb representing 25, 5, and 2.5 m s−1, respectively. The horizontal wind field in (B) is constructed from rawinsonde, pilot balloon (PIBAL), and aircraft data during 1330–1720 UTC 21 May 1987. Terrain contours are every 1.5 km. See Figure 2 in Ref. [63]. Copyright 1998 American Meteorological Society.
Meteorology 01 00006 g025
Figure 26. A schematic diagram for the barrier jet formation. (A) The large-scale low-level flow pattern, (B) mesoscale airflow near the 1 km level and at (C) the 2.5 km level over the Taiwan area are shown. The heavy line, open arrow, and heavy arrow represent the low-level pressure trough, upstream southwesterly flow, and barrier jet, respectively. Terrain contours are 1.5 km. The distribution for the geopotential height in (A) the local sea level pressure pattern (dashed) and (B) streamlines (solid) in (B,C) are also shown. The symbol H (L) marks the locations of high (low) pressure centers. See Figure 10 in Ref. [63]. Copyright 1998 American Meteorological Society.
Meteorology 01 00006 g026
Figure 27. Location of sounding stations (+), the Central Weather Bureau (CWB) surface stations (○), PIBAL stations (*), and tower stations (▿). The terrain contours are 0 (solid), 1 (dashed), and 2 (heavy solid) km. See Figure 1 in Ref. [63]. Copyright 1998 American Meteorological Society.
Meteorology 01 00006 g027
Figure 28. (A) The mean vertical profile (heavy line) of the υs component and the standard deviations (+) computed from the data for the 14 observational times. (B) Same as in (A), except for virtual potential temperature. See Figure 4 in Ref. [63]. Copyright 1998 American Meteorological Society.
Meteorology 01 00006 g028
Figure 29. Initial sounding for 1200 UTC (2000 LST) 21 May 1987 at Tungsha island (island station 46810, 20.7° N, 116.72° E). Thermodynamic profiles plotted on a skew T-log p diagram. Winds (m s−1) with full barb and half barb representing 5 and 2.5 m s−1, respectively. See Figure 2 in Ref. [65]. Copyright 2003 American Meteorological Society.
Meteorology 01 00006 g029
Figure 30. (a) Model winds in the control run at 935 hPa (∼700 m) with full barb and half barb representing 5 and 2.5 m s−1, respectively; (b) model pressure perturbation (hPa) at the surface with 0.2 hPa intervals. See Figure 3 in Ref. [65]. Copyright 2003 American Meteorological Society.
Meteorology 01 00006 g030
Figure 31. Schematic diagram for the structure of the rainband. The barrier jet (BJ) converges with the westerly flow (WF) along the wind shift line (heavy, dashed line) at low levels. The northwesterly flow (NWF) dominates in the upper troposphere. The vertical cross-sections show the long-lived reflectivity maxima embedded in the rainband at the early, well developed, and late stage, respectively. The solid lines represent the radar echo boundary with reflectivity core areas shaded. The thin arrows on the cross sections indicate the relative airflow to the rainband system. See Figure 22 in Ref. [62]. Copyright 1997 American Meteorological Society.
Meteorology 01 00006 g031
Figure 32. A time series (in LST) of radar echoes associated with rainband 2 superimposed on the schematic airflow pattern. Areas with radar reflectivity greater than 30 dBZ at different time are hatched. The schematic airflow pattern is based on PIBAL and sounding data, and winds are derived from dual-Doppler analysis at 1 km. Figure 14 in Ref. [64]. Copyright 2002 American Meteorological Society.
Meteorology 01 00006 g032
Figure 33. (a) Daily rainfall incidences (%) during 10 May–27 June 1987. Contours start at 30% with 10% intervals. (b) The ratio (%) of total rainfall during frontal periods to total TAMEX rainfall. Contours start at 20% with 20% intervals. See Figures 6 and 7 in Ref. [66]. Copyright 1998 American Meteorological Society.
Meteorology 01 00006 g033
Figure 34. Simulated integrated vapor transport (IVT; kg m−1 s−1) in the boundary layer (below 900 hPa) from the 9 km gridded domain (domain 2): (a) 1200 UTC (2000 LST) 1 June 2017; (b) 2200 UTC 1 June (0600 LST) 2 June 2017; (c) 0600 UTC (1400 LST) 2 June 2017. See Figure 9 in Ref. [60]. Copyright 2022 American Meteorological Society.
Meteorology 01 00006 g034
Figure 35. (a) Simulated 950 hPa level winds and maximum radar reflectivity (every 5 dBZ in gray scale) at 2000 LST 2 June for the 3 km grid domain. Terrain contours (dotted lines) are at 200, 500, and 1500 m. The dashed line denotes the approximate position of the wind shift line. The wind speed (m s−1) is specified at the bottom of the figure. (b) Same as (a) but for 2300 LST 2 June. (c) Same as (a) but for 0200 LST 3 June. (d) Same as (a) but for 0400 LST 3 June. (e) Same as (a) but for 0600 LST 3 June. (f) Same as (a) but for 0900 LST 3 June. (g) Same as (a) but for 1200 LST 3 June. See Figure 14 in Ref. [76].
Meteorology 01 00006 g035
Figure 36. Hourly rainfall (mm) and surface winds (one full barb and half barb represent 5 and 2.5 m s−1, respectively) over northern Taiwan: (a) 2000 and (b) 2200 LST 11 June; (c) 0000, (d) 0200, (e) 0400, (f) 0600, (g) 0800, and (h) 1000 LST 12 June. Terrain contours are 100 and 500 m, respectively. See Figure 12 in Ref. [77]. Copyright 2018 American Meteorological Society.
Meteorology 01 00006 g036
Figure 37. Schematic front–terrain interaction for a relatively deep (>1.5 km) Mei-Yu front that moved over the terrain along the northern coast and stalled within the Taipei Basin for more than 6 h. The schematic diagram shows the surface flow patterns (solid arrows), frontal position, and 850 hPa postfrontal wind direction over northern Taiwan (red arrows). See Figure 19 in Ref. [77]. Copyright 2018 American Meteorological Society.
Meteorology 01 00006 g037
Figure 38. The observed station surface winds (m s−1; one full barb represents 5 m s−1) and hourly rainfall accumulation (mm; color shaded) from rain gauges ending at: (a) 0200 LST 2 June 2017; (b) 0300 LST 2 June 2017; (c) 0400 LST 2 June 2017; (d) 0600 LST 2 June 2017; (e) 0800 LST 2 June 2017; (f) 1000 LST 2 June 2017; (g) 1200 LST 2 June 2017; and (h) 1400 LST 2 June 2017. The small black circle represents calm wind. See Figure 4 in Ref. [60]. Copyright 2022 American Meteorological Society.
Meteorology 01 00006 g038
Figure 39. A schematic diagram showing the surface (black solid arrows) and 900 hPa (red solid arrows) flow patterns and the barrier jet (thick red solid arrows). (a) The shallow (<1 km) Mei-Yu front is anchored over the northern side of the Yang-Ming Mountains for almost eight hours during the morning of 2 June 2017 (0200–1000 LST 2 June). At the 900 hPa level, the southwesterly BJ converges with the northwesterly flow in the southwestern flank of the Mei-Yu frontal cyclone around the northern tip of Taiwan. (b) Around noontime, the Mei-Yu front finally moves southward over the Yang-Ming Mountains into the Taipei Basin and converges with the southwesterly BJ over the Taipei Basin. See Figure 21 in Ref. [60]. Copyright 2022 American Meteorological Society.
Meteorology 01 00006 g039
Figure 40. (a) Vertical cross-section of horizontal winds (m s−1; full barb represents 5 m s−1) along (a) the NE–SW red line in Figure 13 and (b) 124° E. See Figure 12 in Ref. [58]. Copyright 2019 American Meteorological Society.
Meteorology 01 00006 g040
Table 1. MBLJ days without TC or TD with center located within 8°–35° N, 105°–150° E over the western Pacific (WP) in June for 21 days (nine events). See Table 1 in Ref. [58]. Copyright 2019 American Meteorological Society.
YearMBLJ Days without TC or TD Center Located over WP in June
200815–17, 27–28
20092–3, 12
201014–15, 24–26
201127–28
20128–10, 23–25
Publisher’s Note: MDPI stays neutral with regard to jurisdictional claims in published maps and institutional affiliations.

