
Electrodeposition of Thick and Crack-Free Fe-Cr-Ni Coatings from a Cr (III) Electrolyte


Materials and Surface Engineering Group, Institute of Materials Science and Engineering, Faculty of Mechanical Engineering, Chemnitz University of Technology, D-09107 Chemnitz, Germany
*
Author to whom correspondence should be addressed.
Coatings 2022, 12(1), 56; https://doi.org/10.3390/coatings12010056
Submission received: 10 December 2021
/
Revised: 21 December 2021
/
Accepted: 24 December 2021
/
Published: 4 January 2022
(This article belongs to the Section Surface Characterization, Deposition and Modification)
Abstract
:The electrodeposition of iron-nickel-chromium coatings is a more environmentally friendly and economical alternative to hard-chrome coatings made from chromium (VI) electrolytes and stainless-steel bulk materials. The aim of the study was to develop a suitable deposition method for thick and low-crack Fe-Cr-Ni coatings. Iron-nickel-chromium coatings were electrodeposited using a more ecological chromium (III) electrolyte with direct current (DC), stepped direct current, and pulse current (PC). The influence of the deposition method on the electrolyte aging, the alloy composition of the coating, and their microstructure was investigated. Corrosion studies of the Fe-Cr-Ni coatings in 3.5% NaCl solution were performed using polarization tests. Furthermore, hardness measurements and scratch tests were carried out to determine the adhesion strength. Phase analyses were performed by X-ray diffraction, and the chemical composition and microstructure were characterized by scanning electron microscopy. Using the stepped DC and PC method, crack-free Fe-Cr-Ni coatings were successfully deposited.
1. Introduction
Hexavalent chromium has been listed as a substance of very high concern due to its carcinogenic and mutagenic properties and may no longer be used without authorization or exemption under REACH (Registration, Evaluation, Authorisation and Restriction of Chemicals) since 21 September 2017 [1]. Up until now, chromium coatings have still been electrochemically deposited from these chromium compounds. The advantages of these chromium coatings are their silvery appearance, their high hardness and their very good wear and corrosion resistances [2,3]. This does not even take the decades of experience in industrial electrodeposition into account. As a result, hard-chrome coatings (layer thickness < 10 µm) are used extensively in industry for a wide range of applications and products [4]. Therefore, a quick development of galvanic electrolytes, which offer alternative layers to hard chrome, is of great importance. While bright-chrome plating is predominantly done from REACH-compliant chromium (III)-containing electrolytes, no comparable properties are currently achievable for hard-chrome coatings. It is, therefore, only a matter of time before the chromium-trioxide-based process disappears from the EU’s domestic market. For this reason, from an economic point of view, it is becoming increasingly attractive to develop and qualify alternative coatings and alloys.
Iron-nickel-chromium (Fe-Ni-Cr) steels offer a similarly outstanding range of properties compared to hard chrome. So far, however, the alloys have mainly been used in the form of bulk materials. In addition, these steels are quite expensive and heavy due to their high density, which is why they are not considered in, e.g., the field of lightweight construction. Electroplating could be an economical process for applying stainless-steel coatings onto less expensive materials such as structural steel and thus maintaining the excellent surface properties while reducing material costs.
Only a few studies on Fe-Cr-Ni depositions have been conducted so far. Most studies dealt with the electrolyte composition and its influence on the distribution of the alloy composition as well as the effects on the microstructure [5,6,7,8]. Even fewer studies have dealt with the corrosion behavior of electroplated Fe-Cr-Ni coatings [9,10]. Pure chromium and electroplated Fe-Cr-Ni deposits are nanocrystalline, which lead to high residual stresses and thus microcracks in the coatings [5,11]. A characteristic of almost all chromium coatings is the formation of microcracks, which are associated with the discontinuous evolution of hydrogen [12]. The cracks extend through the entire layer to the substrate [13]. A study from 1997 on the cracking behavior of thick Fe-Ni coatings discovered that there was a decrease in residual stresses when the coating thickness was increased. Crack propagation occurred when the thickness of the deposit exceeded the critical crack length, which is about 1 µm [14]. For Fe-Cr-Ni alloys, crack-free coatings with thicknesses less than 5 µm were observed [5]. Tests of Fe-Cr-Ni depositions produced from single and double cells showed clear differences in surface finish. The deposits from the single cell were light gray and essentially very smooth, while those from the double cell showed a dark gray appearance with many spherical deposits [7]. The emergence of microcracks and the corrosion current density in Fe-Cr-Ni alloys electrodeposited under pulsed current (PC) are lower than under direct current (DC) [10]. Microcracks significantly promote crevice corrosion of surfaces and significantly reduce the corrosion resistance. In a pulse current deposition, the pH increase at the double layer of the cathode is interrupted and reversed. The associated formation of chromium hydrides and their deposition in the chromium layers, which lead to cracking, is reduced [15]. A significant extension of the pause times in the form of stepped DC deposition could further enhance this effect and is shown in this work. Based on these assumptions mentioned, the influence of the electrical current mode (DC, stepped DC, PC) during deposition on the microstructure and layer properties of Fe-Cr-Ni coatings will be investigated in this paper. The elimination of microcracks while achieving a high layer thickness is of particular importance. This further improves the corrosion and mechanical properties as well as their visual appearance.
2. Materials and Methods
2.1. Substrate Preparation and Electrodeposition
In order to investigate the influence of current mode and electrolyte aging on Fe-Cr-Ni coatings in terms of their alloy composition, microstructure, corrosion, and wear behavior, the electrolyte listed in Table 1 was used. The layers were electrodeposited on copper substrates with a dimension of 2 cm × 2 cm. These substrates were highly polished Hull-cell sheets from Mercanta (Dinslaken, Germany), which were cleansed in an ultrasonic bath with ethanol and then rinsed with deionized water. The copper substrates were further coated wet-on-wet directly after this pretreatment.
The electrolyte was prepared in two steps following the method used by Hasegawa et al. [7]. The glycine is dissolved together with the chromium (III) chloride in deionized water and kept at 80 °C for 30 min with continuous stirring and then cooled down to room temperature. In parallel, all the remaining components were dissolved in deionized water at room temperature. Both electrolyte components were kept overnight under permanent bath agitation. This procedure is applied for thorough dissolution of the bath components and complex formation. Finally, the two solutions were mixed and thoroughly stirred. The pH was adjusted with hydrochloric acid.
In Table 2, the deposition parameters are listed. For each sample, the effective deposition time was 120 min. The POWER-PULSE pe86CB-40-10-50-S/GD pulse-current source (plating electronic GmbH, Sexau, Germany) was used for the deposition of the stepped DC and the PC samples. For the stepped DC coatings, the on-off time was ton = 10 s and toff = 5 s and for the PC coatings ton/off = 10 ms. The PC coatings were generated at a frequency of 50 Hz and an on-off ratio of 1:1. The cathode had an area of 4 cm2. An insoluble titanium platinum anode was used for all depositions. The parameters were chosen based on the findings of El-Sharif et al. [16] on the deposition of thick chromium coatings from a chromium (III) glycine electrolyte and determined in preliminary tests. Here, a small anode-cathode distance as well as a low bath agitation turned out to be particularly advantageous for glossy, thick coatings, which is in agreement with the findings of El-Sharif et al. [16].
In order to investigate possible electrolyte aging and its influences on the composition and layer thickness of the alloy, three sheets (No. 1–3) for each current mode were electrodeposited successively for two hours in the same electrolyte.
For scanning electron microscopy studies, all coatings were embedded, ground, polished, and thoroughly cleansed with isopropanol under ultrasonic influence. To minimize preparation-related effects such as residual-stress generation due to heating, the samples were cold-embedded in epoxy resin and then vapor-deposited with carbon to ensure the electrical conductivity of the samples.
2.2. Layer Characterization
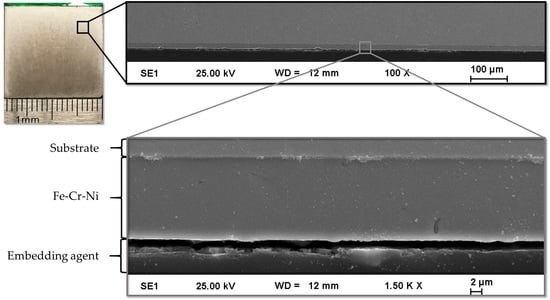
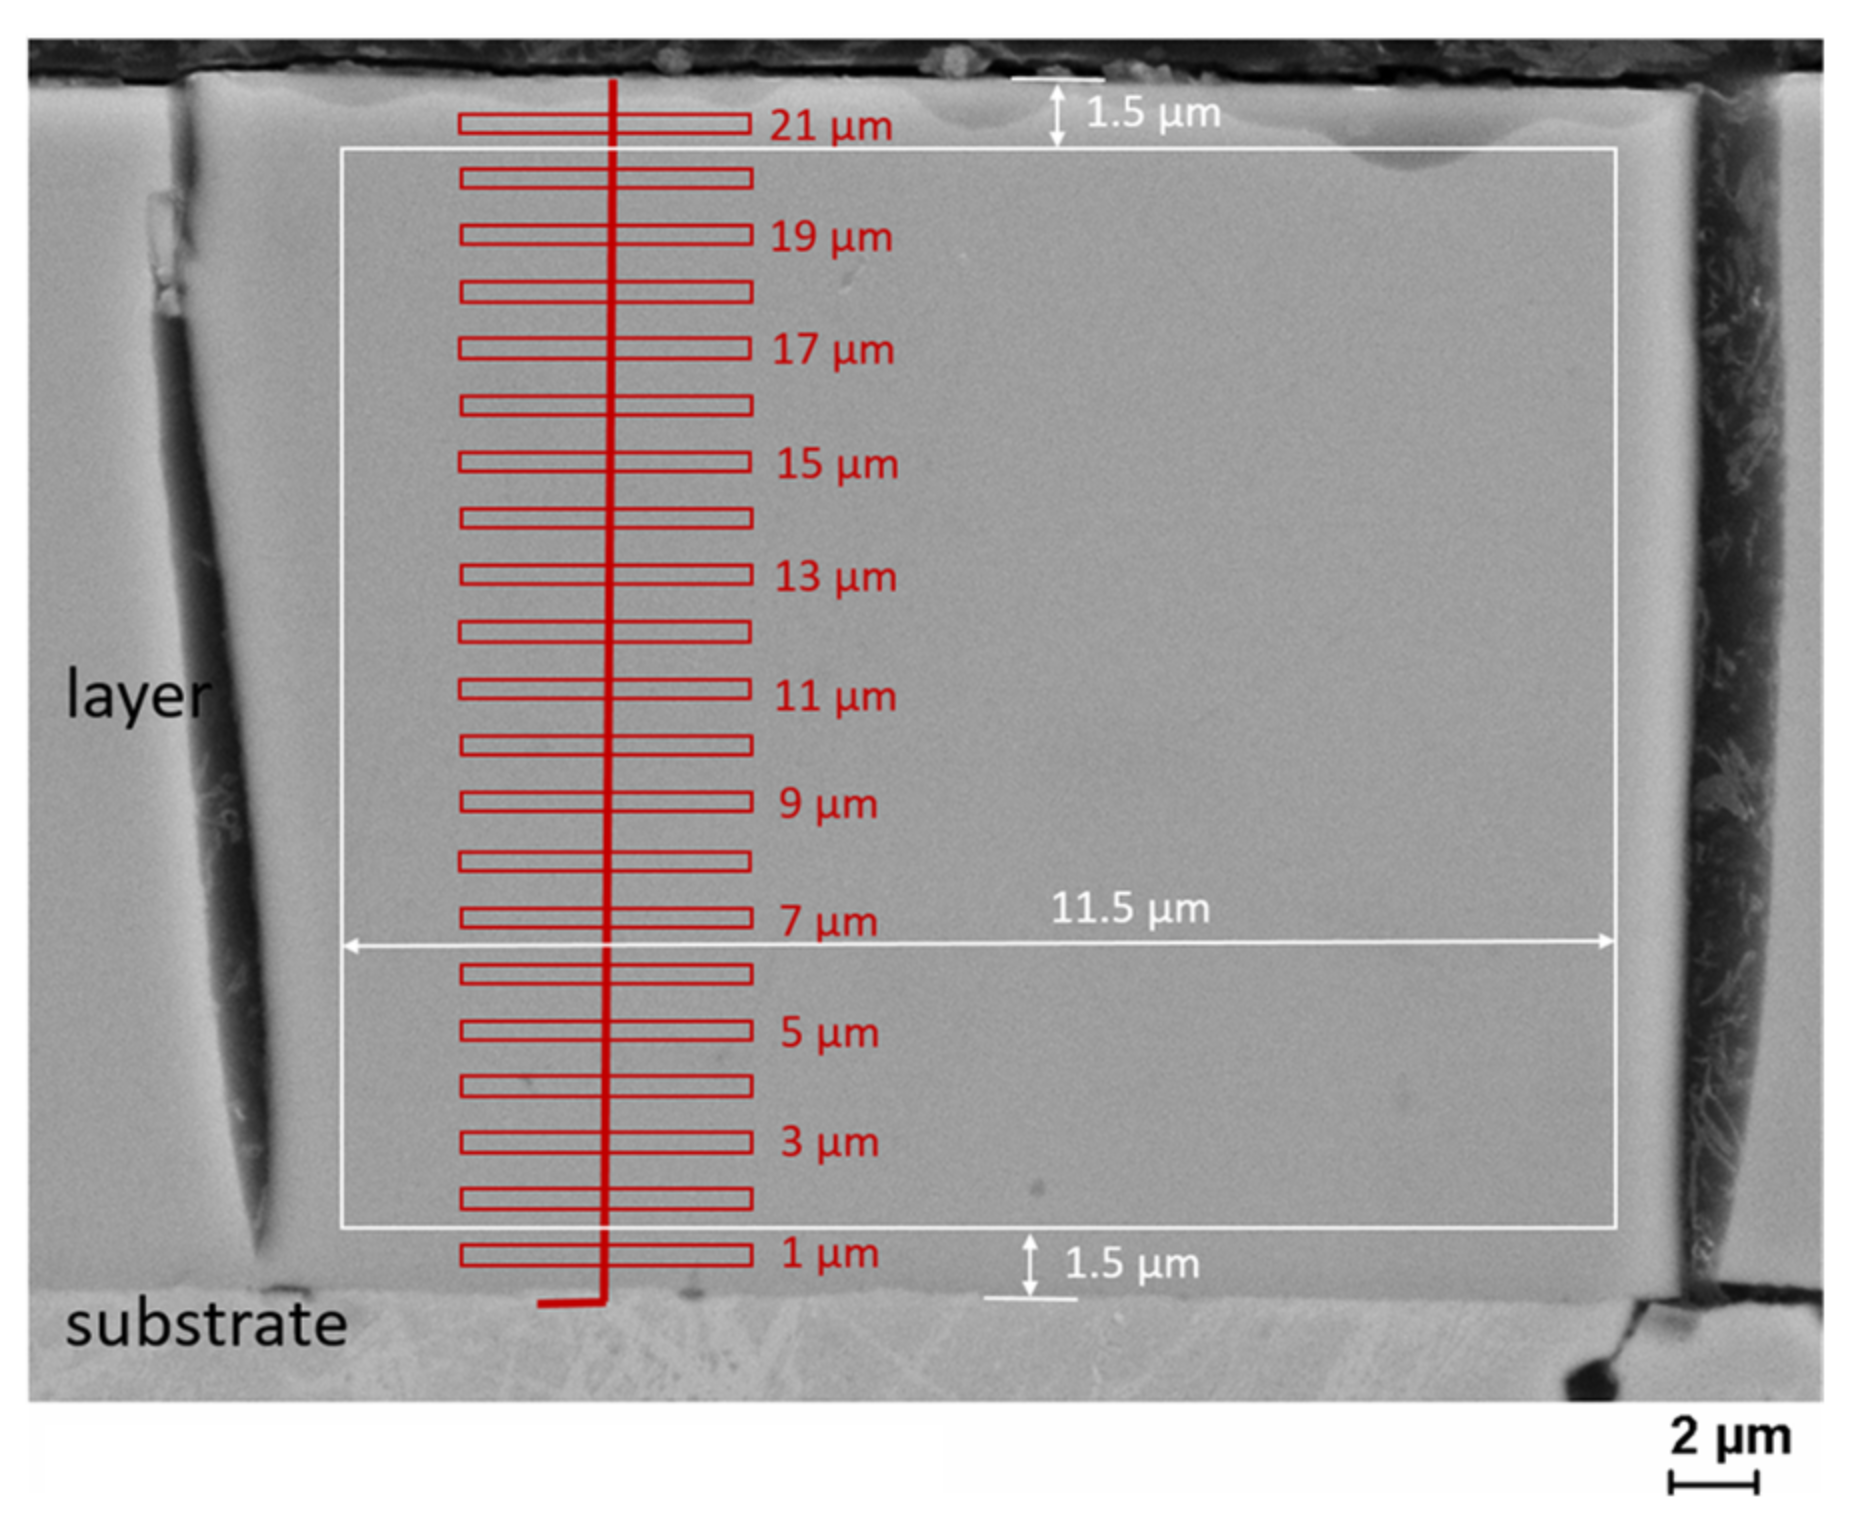
The alloy composition of the Fe-Cr-Ni layers was determined in cross-section. The elements were determined using an EDAX GENESIS energy-dispersive X-ray spectroscopy (EDXS) spectrometer at a LEO1455VP (Zeiss, Oberkochen, Germany) scanning electron microscope with an integration time per element analysis of two minutes (accelerating voltage: 25 kV). The elements were determined by area and point analyses, as shown in Figure 1. For point like analyses, small fields of a size of 0.4 µm height and 5.5 µm width were set as a function of the depth below the surface. In addition, scanning electron microscopy (SEM) images were taken to investigate microcracks in the layers.
Corrosion was studied by polarization tests at room temperature using an electrochemical workstation ZENNIUM (ZAHNER-elektrik GmbH & Co, Kronach, Germany) in 3.5% NaCl aqueous solution. As the reference electrode, an Ag/AgCl (saturated KCl) electrode was used. The open-circuit potential (OCP) was recorded for 20 min before each measurement. The selected potential range (relative to the final OCP value) was between −150 and 1200 mV at a scan rate of 1 mV·s. The corrosion current density icorr and corrosion potential Ecorr were determined from the recorded data. The coatings were compared to conventional hard-chrome coatings and AISI 304 stainless steel bulk material.
The phase analyses were performed by X-ray diffraction (XRD) using a D8 Discover diffractometer (Bruker, Billerica, MA, USA) with Co Kα radiation, polycap optics, and a 1 mm hole aperture. An energy-filtered 1D detector LYNXEYE XE-T (Bruker, Billerica, MA, USA) was used. The diffraction-angle range of 20°–130° was measured with a step size of 0.03° and 6.4 s/step. The phase assignment was done using the PDF-2 database 2014 (ICDD).
For wear testing, the scratch test was used to assess the adhesion of the Fe-Cr-Ni coatings to the Cu substrate. To determine the critical normal force Lc, a scratch test with increasing load from 1 N to 50 N at 10 mm scratch length with 2.49 mm min−1 was performed on all specimens. The REVETEST® (CSM Instruments, Peseux, Switzerland) was used to carry out both progressive- and constant-load scratch tests. A Rockwell diamond with a tip angle of 120° and a rounded tip radius of 200 μm served as the indenter. Both the indenter and the specimen’s surface were cleansed with ethanol before each scratch test.
The hardness was determined on the cross sections. The device FISCHERCOPE® HM 2000 XYp (Sindelfingen, Germany) was used, which determines both the Martens hardness and the Vickers hardness. Ten hardness measurements were carried out per cross-section specimen in the center area of the layer with a load of 50 mN for 30 s.
3. Results and Discussion
3.1. Element Composition
In Table 3, the element composition is listed for all samples. The numbers 1 to 3 represent the sequence of deposits from an electrolyte bath. The element compositions were measured by using EDXS with area analyses including the metallic species of chromium, iron, and nickel as well as the contamination by carbon and oxygen. The values are given in mass fractions w. It can be observed that the oxygen content is at a similar level for conventional DC deposition just like the stepwise DC deposition. For PC depositions, the oxygen content wO is nearly 4% lower. The chloride contents are on the same level for all Fe-Cr-Ni coatings. Despite aging of the electrolyte, the stepped DC and PC depositions show nearly constant alloy compositions. For the samples deposited under DC conditions, the average chromium content increases with each following deposition, while the iron and nickel contents of the alloys decrease. From this, it can be concluded that pause times allow uniform usage of the electrolyte and ensure an even ion incorporation into the layer.
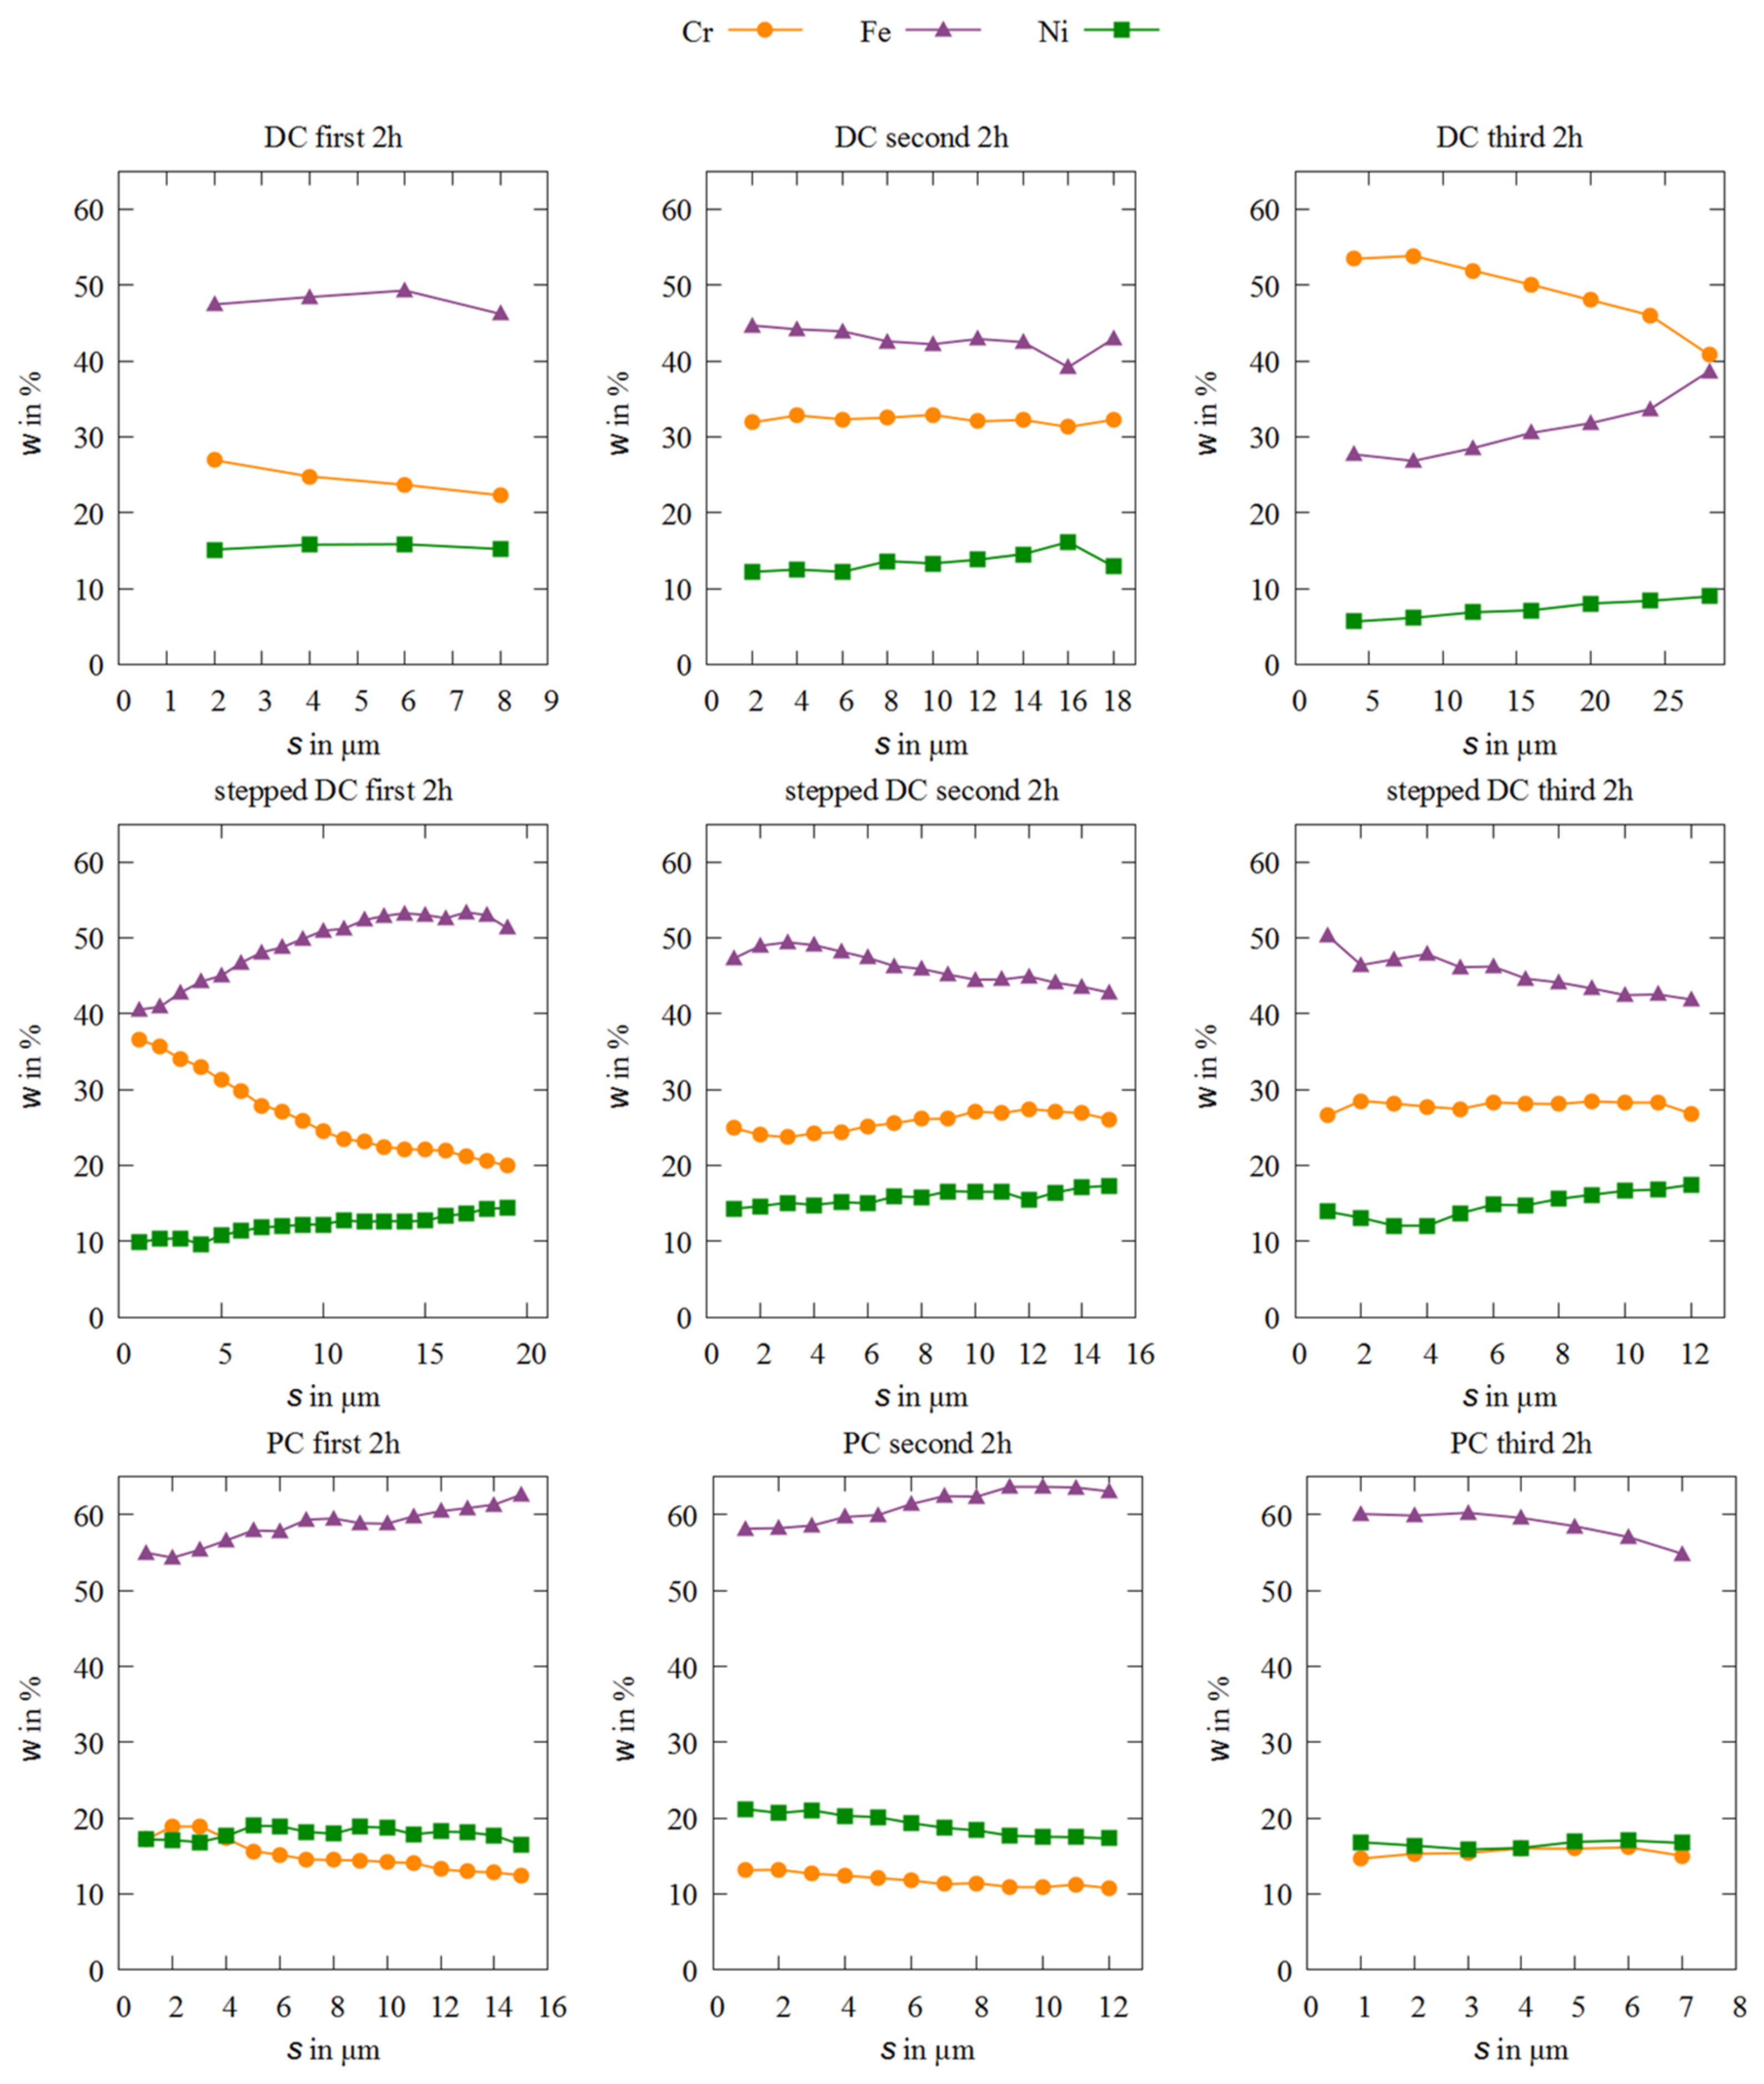
In Figure 2 and Figure 3, representative measurements of depth profiles are shown (s—distance from the substrate).
The oxygen and chloride contents, which originate from the electrolyte additives, over the entire layer cross-sections are presented in the profiles of Figure 2. It is observed that the oxygen content is evenly distributed over the entire layer thickness in all layers. The oxygen values and curves of the DC and stepped DC samples correspond roughly to the results from a study on the heat treatment of Fe-Cr-Ni and Fe-Cr layers [11]. The use of PC reduces the incorporation of oxygen by approx. wO = 4%. The incorporation of chloride is very low at around wCl = 0.5% compared to the contamination by oxygen. For all samples except the third PC sample, in which wCl is 0.3% higher, the values are in the same range. From this, it can be deduced that neither prolonged bath use nor current flow have a significant influence on the incorporation of chlorine.
The data in Figure 3 confirm that the alloy composition over the entire coating thickness for the DC samples for the first and second deposition are nearly constant, but at the third deposition the alloy composition deviates strongly. In the third DC deposition in a row, the chromium content is significantly larger and the iron content significantly smaller compared to the first and second deposition. In addition, the local distribution of the chemical elements varies strongly: Cr starts at wCr = 55% at the substrate and decreases over the layer thickness to wCr = 40%, while at the same time the iron content increases from 29% to 39%. This strongly suggests that after 4 h coating time with DC, the equilibrium ratios of the metal ion complexes in the electrolyte begin to change. When using stepped DC, it behaves the opposite way. There, the electrolyte needs a run-in time to establish an equilibrium, which ensures a constant alloy composition of about wFe = 45%, wCr = 25%–30% and wNi = 15%. Compared to the study by Adelkhani et al. which indicated a chromium content of 5%–15%, the contents measured here are up to 35% higher. [10]. Only the chromium content of the Fe-Cr-Ni samples produced under PC conditions corresponds to these values. Other studies have also achieved a similar alloy composition like Adelkhani et al. [8,17]. Apparently, the use of pulse current favors the deposition of iron, while the deposition of chromium is disadvantaged. The fraction of nickel in the alloys is about the same as in the other layers. Overall, both the current mode and the consumption of the electrolyte within 6 h do not seem to have any strong effect on the nickel content in the alloy.
3.2. Microstructure
In the following section, the influence of the electric current on microstructure and applicable coating thickness is investigated.
Despite unchanged coating time, the coating thickness increases with the duration of bath use when using conventional DC. While the coating thickness using a fresh electrolyte is still 10.2 µm with a coating time of two hours, it is already 15.4 µm with the second deposition and even 30.1 µm with the third. In the period studied here, no change in the electrolyte is observed that has a negative effect on the deposition rate. Looking at the cross-section, it becomes obvious that the first layer in Figure 4a shows clear material chipping, especially near the surface. Microcracks are not visible on this sample, but due to the severe damage caused by the chipping, they cannot be excluded. This indicates a very brittle material behavior and high residual stresses in the Fe-Cr-Ni layer. The reason for this could be the somewhat higher contamination by oxygen and chorine near the surface compared to the two subsequent layers. With each new use of the bath, the applicable film thickness has almost doubled. The thickest layer shows a clear crack pattern similar to that of hard chrome. With progressive deposition and layer thickness, the layers show a matt and rough surface with noticeably spalling at the edges of the sample. In Figure 4b, thin vertical microcracks can be observed. The crack pattern of distinct vertical cracks running through the entire layer thickness is absent and the crack density is very low. The third deposition in Figure 4c shows clear microcracks extending from the surface through the entire layer to the substrate. Slight material chipping near the surface can also be observed on this sample.
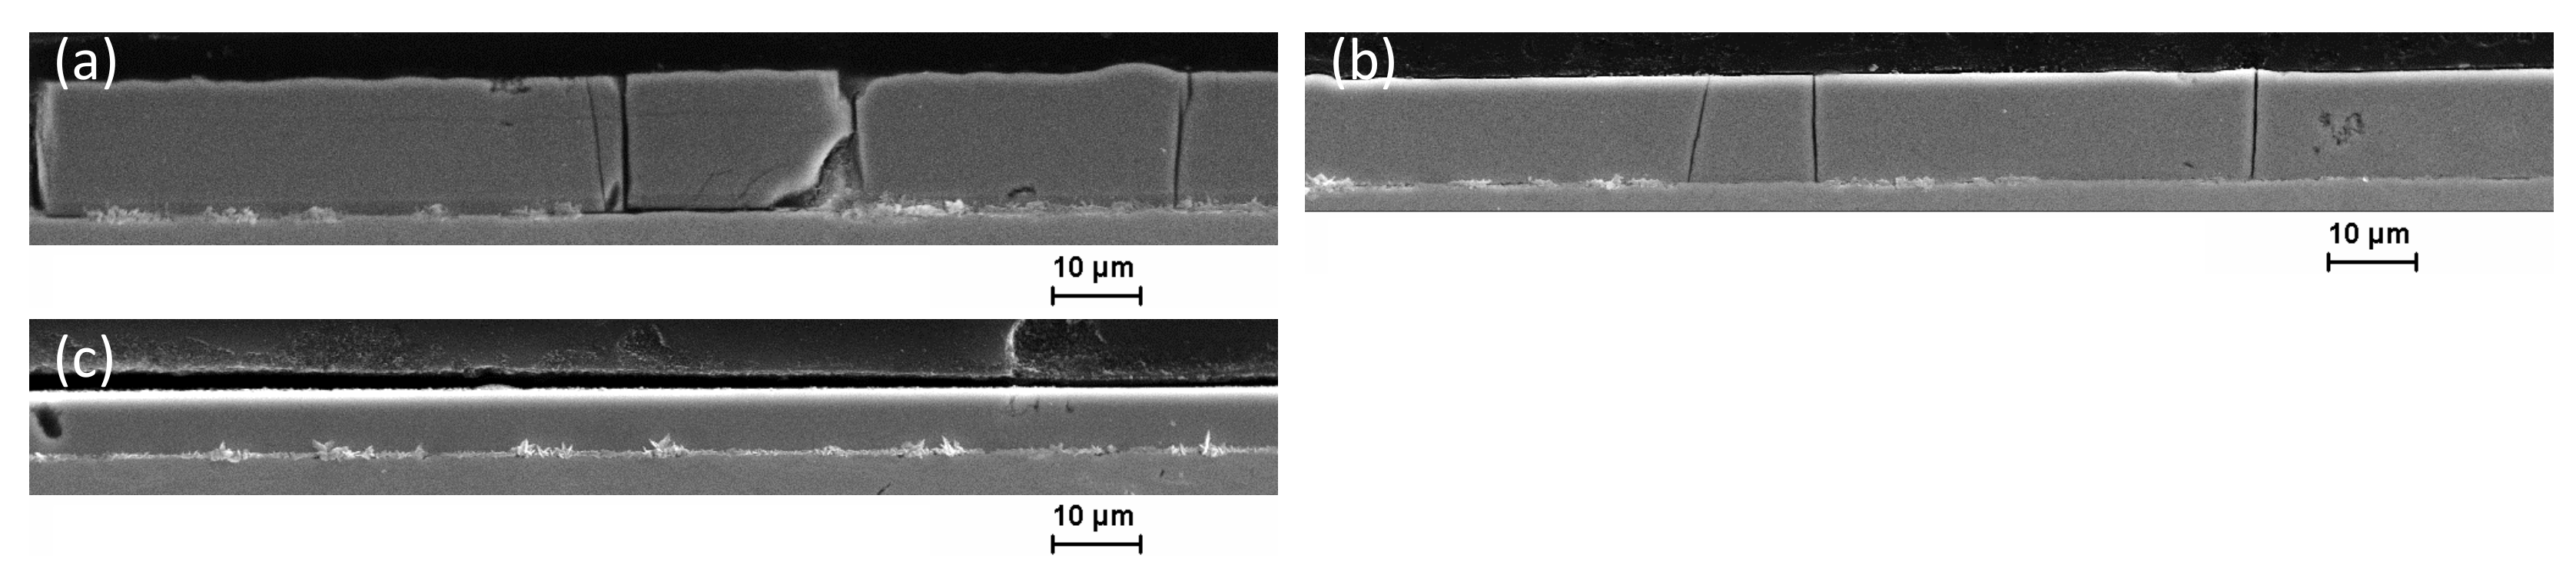
The SEM images in Figure 5 clearly shows that with progressive electrolyte use, the layer thickness decreases in the case of stepped DC deposition. The appearance of the first and second coating is even and bright. Compared to the coatings deposited under DC conditions, the edge-effects and the associated coating flaking are lower for these specimens. The Fe-Cr-Ni layer in Figure 5b, which originates from the second bath use, shows no microcracks over the entire cross-section. The SEM images of the layer cross-sections in Figure 5a,c show distinct microcracks. The third deposition from the electrolyte bath, however, shows a rough and matte surface with preparation-related layer delamination from the copper substrate. The SEM analyses indicate inadequate coating adhesion of this Fe-Cr-Ni layer, yet these layers contain slightly less microcracks than the first layer from this series of experiments. With an increasing duration of electrolyte use, the applicable layer thickness decreases in the first two hours in the case of stepped DC deposition from about 25 µm in the first deposition to approx. 16 µm in the second and third deposition. After the first two hours, the following two layers could be produced without further loss of layer thickness. Based on this and the constant alloy composition, it can be deduced that the electrolyte has run in after the first 2 h using the stepped DC method and enables thick and crack free or low-crack Fe-Cr-Ni depositions.
When examining the SEM images in Figure 6 of the coatings deposited under pulsed current, it can be seen, similar to the coatings applied under stepped DC, that the coating thickness decreases with progressive bath utilization. The layer thickness of the first sample is 15.5 µm, the third layer is not even half as thick. At the same time, a decrease in microcrack density can be observed. The third Fe-Cr-Ni layer deposited from the electrolyte by PC shows no cracks in the scanning electron microscopic images. One reason for the lower crack density of the PC layer could be the approximately 10% lower chromium content compared to the stepped and conventionally applied coatings. All Fe-Cr-Ni samples deposited under PC show an even and shiny surface.
Thus, it can be seen that there are great differences in the approach to the electrochemical deposition of Fe-Cr-Ni coatings. However, the cause of the different deposition methods will be the subject of future research.
Possible considerations in this regard could be derived from observing the interrupted depositions (PC and stepped DC). During the pause times, the hydrogen, previously formed during galvanic deposition, is released from the deposit. As a result, the internal stresses decrease and the resulting hydrogen embrittlement in the layers is reduced, which is largely responsible for the formation of cracks in galvanic layers [18]. It is also assumed that the galvanic deposition of chromium (III) alloys results in high overpotentials, which lead to an increase of the pH value at the cathode and the formation of chromium hydrides. These incorporated chromium hydrides are hexagonal close packed (hcp) and unstable. In the course of the deposition process and shortly afterwards, they decompose into metallic chromium, which is body-centered cubic (bcc) [19]. During this phase transition, the chromium volume shrinks by approximately 15%, which leads to the formation of cracks in the layer [19]. In studies of the decrease in deposition rate at high current densities in chromium (III) electrolytes, the pH change at the cathode surface was measured. This near-surface pH ranged from about 3.8 at a current density of 1 A/dm2 to 6.8 at 12 A/dm2. After current termination, the pH at the surface decreased and approached that of the bulk electrolyte. At a current density of 4 A/dm2 and above, a pH value of 5 is present at the cathode surface, where most of the chromium (III) is present as chromium hydroxide, which cannot be reduced to chromium metal. The higher this current density, the higher the pH value, the fewer chromium (III) ions are available [20].
A stepped electrodeposition regularly interrupts the deposition process. The pH value on the surface drops during the breaks and adjusts to the pH value of the bulk electrolyte. It helps to keep the electrolyte equilibrium constant and enables the application of thick and less cracked layers. It is also conceivable that the chromium hydrides, which are located on the surface of the sample, decompose during the pause times. Furthermore, the pause times favor a stabilization of the time dependent electrolyte equilibrium in which complex compounds can accumulate at the double layer, which is depleted under normal DC. Further investigations will be performed in future studies. One explanation for the higher crack density and the much lower deposition rate in the Fe-Cr-Ni layers under PC deposition compared to the stepped DC coatings could be the too short pause times, which do not provide sufficient recovery of electrolyte equilibrium.
In summary, for the DC coatings an increase in film thickness and microcrack density as well as a sharp change in alloy composition can be observed with increasing electrolyte aging. A stepped DC deposition leads to a more stable alloy composition, layer thickness and a significant decrease of microcrack density despite increasing electrolyte aging. A PC deposition also leads to a decrease of the number of microcracks, but also to a significantly lower chromium content. With increasing electrolyte aging the deposition rate decreases significantly compared to the other two electrical current methods.
3.3. Phase Analyses
For the diffraction diagrams of the Fe-Cr-Ni films shown in Figure 7, as expected, a nanocrystalline structure can be observed for all of them. The narrow peaks (numbered 1) are caused by the copper substrate. It is noticeable that the layers applied under DC and stepped DC can hardly be distinguished from each other. Thus, the crack-free and crack-poor layers cannot be attributed to a change in crystal structure. In comparison, a pronounced peak can be seen in the PC sample. This indicates that crystal growth is starting to occur here. Although PC plating generally leads to grain refinement, it seems to promote crystal growth in nanocrystalline structures. It is possible that the observed lower deposition rate leads to crystal growth due to a change in the electrolyte equilibrium ratio under PC. According to the inverse Hall-Petch-relationship, microstructures with larger crystallites are not as susceptible to high residual stresses as nanocrystalline materials, which, in turn, has a positive effect on the crack reduction and results in uniform layer [21].
3.4. Hardness and Wear Resistance
Figure 8 shows the Martens hardness values of the Fe-Cr-Ni layers depending on the coating method and in comparison to hard chrome. By comparing the layers with one another, it is noticeable that all coating methods are almost on the same hardness level. The results of the Vickers hardness measurements are in agreement with previous studies of electrodeposited Fe-Cr-Ni alloys [9,22]. Hydrogen embrittlement of galvanically applied layers leads to internal stresses and thus to crack formation without an increase in mechanical strength. In this regard, it should be noted that the average chromium content of the PC samples, which have approx. wCr = 10% chromium content, do not exhibit any loss of hardness. PC deposition leads to a higher nucleation rate, which causes a higher hardness due to the Hall-Petch relationship. The Martens hardness of hard-chrome layers is about 6500 N mm2. Consequently, the applied layers achieve a hardness of 52% of hard chrome. The crystallite size of electroplated hard chrome is between 50 and 200 nm [23]. In the literature you can find a crystallite size of 20–25 nm for Fe-Cr-Ni layers [5]. An inverse Hall-Petch effect for nanocrystalline materials has been observed by a large number of researchers. For example, the critical grain size of nickel was determined at about 20 nm [24]. Below this grain size, an inverse Hall-Petch effect was observed. All crystallite sizes of the layers studied here are below 2 nm. Therefore, it can be assumed that this inverse Hall-Petch effect is present in Fe-Cr-Ni films. From the XRD analyses, it can be seen that slightly larger crystallites are formed by PC deposition. On these samples, the inverse Hall-Petch effect probably will not be quite as pronounced, so that the low chromium content can be compensated. At the same time, the inverse Hall-Petch effect is also responsible for the significantly lower hardness of the Fe-Cr-Ni deposits compared to the hard-chrome coating. The first sample, which was deposited under DC, was too fissured due to its brittleness to be able to measure its hardness.
For the investigations of the adhesion strength of the coatings by the scratch test, only the samples from the second deposition were selected due to their uniform and even appearance and similar coating thickness. The results of this investigation are listed in Table 4. There is no significant increase in the critical normal force Lc and thus the bond strength of the coatings, but it can be noticed that a stepped DC or PC deposition yields an improvement in coating adhesion.
3.5. Corrosion Resistance of Coatings
Table 5 shows the extracted corrosion current densities and corrosion potentials of the Fe-Cr-Ni coatings, the hard-chrome coatings, and the AISI 304 stainless steel bulk material from the polarization tests.
Figure 9 shows the extracted corrosion current densities directly of the Fe-Cr-Ni layers compared to hard-chrome coatings and stainless steel (bulk). The corrosion current densities of the Fe-Cr-Ni layers deposited by stepped DC show the lowest values of all Fe-Cr-Ni layers. The PC deposited coatings performed the worst. A reason for that behavior could be the lower chromium content of these samples (wCr = 10%). The stepped-DC samples exhibit only about half the corrosion current density of the PC coatings and are about 20% lower than that of the classically applied DC coatings. The microstructure may be responsible for this lower corrosion current density. Since the stepped-DC coatings have a significantly lower crack density, the effect of contact corrosion due to electrolyte contact with both the layer and the substrate is significantly lower here. However, the corrosion current density of the Fe-Cr-Ni coatings is between 21 and 44 times higher than that of pure hard-chromium coatings. The microcracks allows oxygen to penetrate the substrate where it reacts with the copper, increasing the corrosion current density. Akram et al. [25] specify for their High Velocity Oxy Fuel (HVOF)-sprayed chromite coatings a corrosion current density in 3.5% NaCl solution of 5.59 × 10⁻⁶ A/cm2. Thus, the corrosion current densities of the electrodeposited Fe-Cr-Ni coatings (between 1.18 × 10⁻⁶ and 2.49 × 10⁻⁶ A/cm2) studied here are in this order of magnitude and may even exhibit a slightly better corrosion rate.
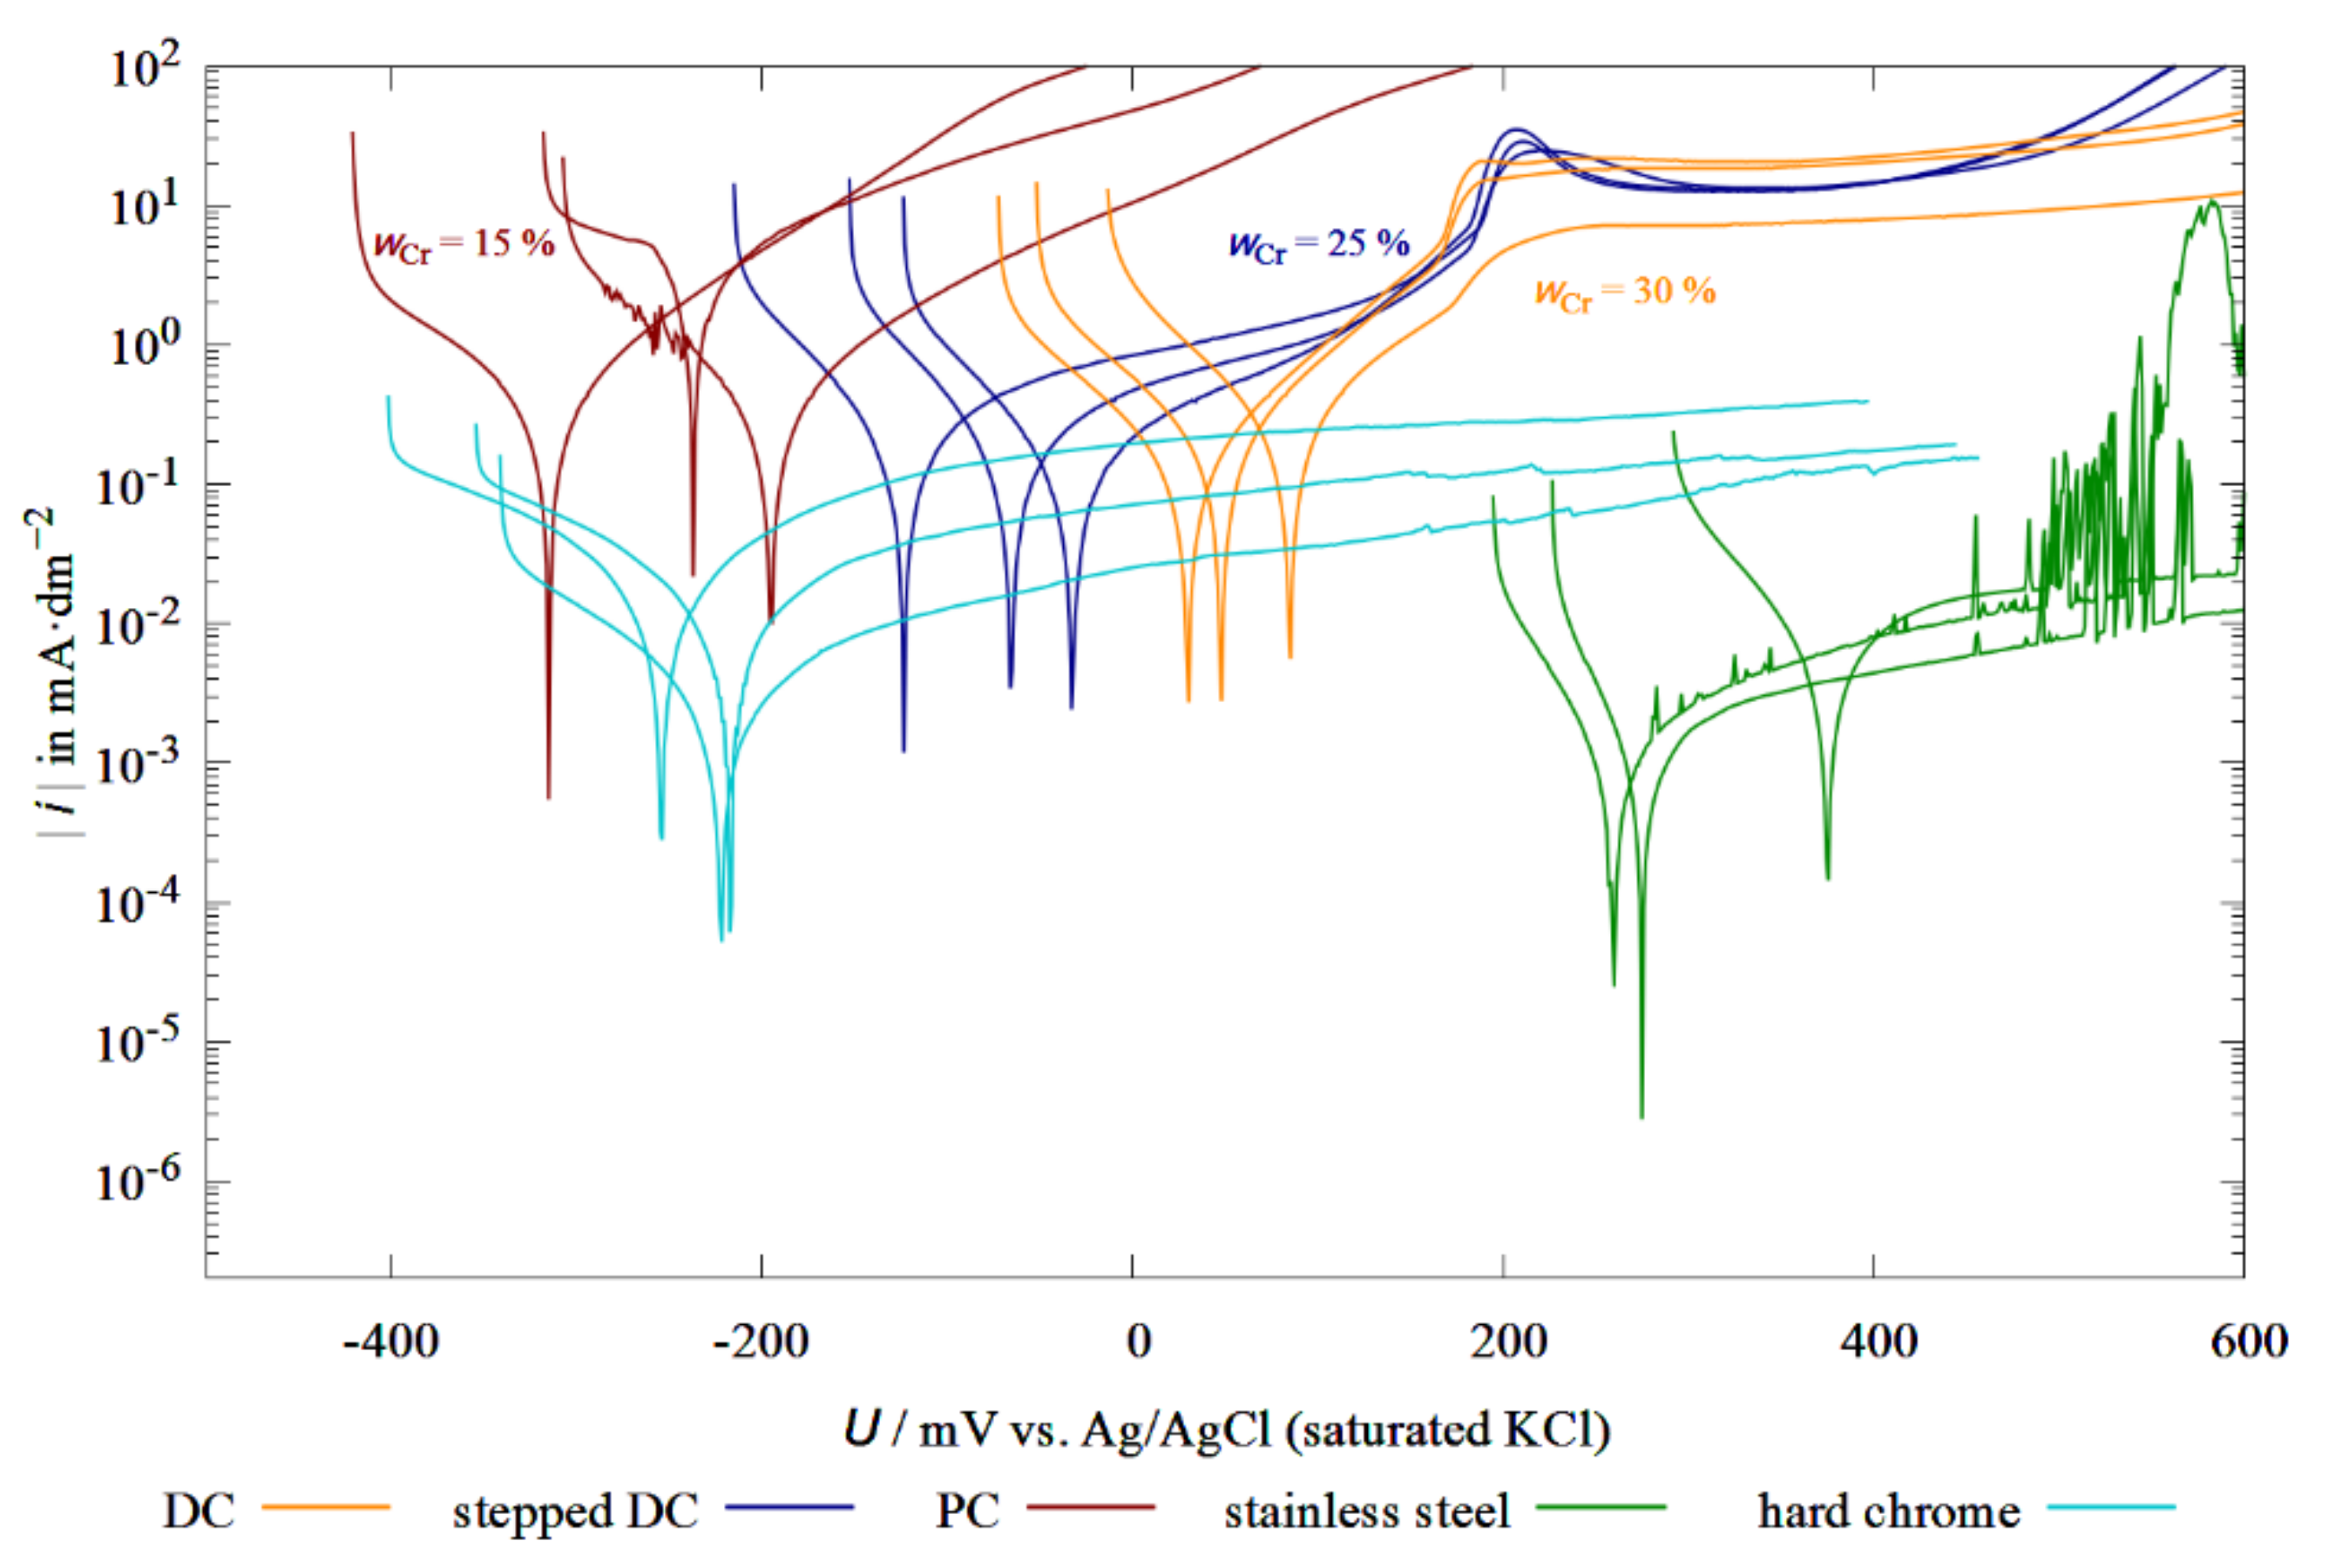
Figure 10 shows the current density as a function of the applied potential of different deposition methods. The polarization curves obtained are reasonably reproducible. It is noticeable that DC coatings and PC coatings have a negative corrosion potential, whereas that of pure DC coatings is positive. From this, a clear trend can be observed that there is a positive shift in the corrosion potentials with increasing chromium content in the Fe-Cr-Ni coatings. Compared to the stepped-DC and PC coatings, the DC coatings have a higher microcrack density and the individual cracks are more pronounced. As a result, more NaCl solution reaches the substrate material (copper) and an increased cathodic reaction takes place on the nobler copper, which shifts the corrosion current potential towards positive values. The difference in electrochemical behavior between the electrodeposited Fe-Cr-Ni samples and the AISI 304 stainless steel is attributed to the dissimilarities in the microstructure and chemical composition of the passive oxide film [26]. As previously shown in the study on the influence of heat treatment on the microstructure of Fe-Cr-Ni coatings, electrodeposited Fe-Cr-Ni alloys are amorphous or nanocrystalline in contrast to its metallurgical crystalline counterpart [11]. In addition, the incorporation of oxides, chlorides, hydroxides, and hydrides by electrolyte additives into the coating leads to enhanced hydrogen evolution reactions [19,27] and a passive oxide layer that differs in chemical composition from that of AISI stainless steels. The DC samples and the stepped-DC samples both exhibit a passivation peak at a potential of about 180 mV. The observations made here are consistent with those from the experiments in aqueous sulfuric acid by Bertero et al. [26]. In the 2018 study, very broad current peaks for electrodeposited Fe-Cr-Ni coatings with wCr = 12%–18% were recorded between −200 and 400 mV [26]. During the formation of chromium oxides on the precipitates, the previously dissolved Fe2+ and Fe3+ ions are stabilized [28]. It can also be observed that with a higher chromium content, the current peaks are a little flatter. Passive layers prevent the penetration of oxygen into the substrate material and thus reduce the overall corrosion. The current density-potential curves of the PC samples have no such peaks, indicating that no passivating oxide layer has formed in these samples. One reason for this could be the Cr content, which is below 12% and thus does not allow for the formation of a protective oxide layer. This could also explain the significantly higher corrosion current densities of these specimens. The influence of the nickel on the corrosion behavior can be neglected since the nickel content was approximately the same in all three coating types.
4. Conclusions
Fe-Cr-Ni electrodepositions were investigated under different current modes and as a function of electrolyte change over time. The aim of the investigations was to determine the resulting influence on the alloy composition, as well as the changes in the mechanical and corrosive properties. The work shows that, it was possible to obtain thick and crack-free Fe-Cr-Ni alloys with largely uniformly shiny surfaces in a metallic gray color from a Cr (III) electrolyte for the first time. The electrochemical alloy depositions are mainly influenced by the duration of electrolyte use and the defined coating parameters (DC, stepped DC and PC).
Here, the pauses (time without applied current) can reduce negative effects caused, for example, by incorporation of electrolyte additives into the alloy, if the pauses are significantly longer than in PC depositions. This can lead to a reduction in residual stresses in the layers and also fewer microcracks in the Fe-Cr-Ni layers. Thus, it was possible to present a thick and crack-free Fe-Cr-Ni layer with homogeneous alloy composition after a reasonable run-in time of the electrolyte. However, the current forms investigated do not seem to have a significant effect on hardness and coating adhesion. On the other hand, the electric current has a positive influence on the corrosion resistance. For both the conventional and stepped DC coatings, an anodic peak can be recorded from the current density potential curves, indicating passive film formation. Nevertheless, the stepped DC coatings without microcracks are about 20% more corrosion resistant than the pure DC coatings. The high thicknesses of the individual deposition modes also show promising results when using this Cr (III) electrolyte with the discussed deposition parameters.
In the future, further studies will be conducted to optimize the promising stepped DC depositions, gain further understanding of the electrolyte processes, and thus advance the optimization of alloy composition, electrolyte utilization, and microstructure.
Author Contributions
Conceptualization, V.M. and D.H.; methodology, V.M. and D.H.; validation, V.M. and D.H.; formal analysis, V.M., D.H. and T.M.; investigation, V.M. and D.H.; writing—original draft preparation, V.M. and D.H.; writing—review and editing, T.M. and T.L.; supervision, T.M. and T.L.; project administration, V.M., D.H., T.M. and T.L. All authors have read and agreed to the published version of the manuscript.
Funding
The publication of this article was funded by Chemnitz University of Technology.
Institutional Review Board Statement
Not applicable.
Informed Consent Statement
Not applicable.
Data Availability Statement
The data presented in this study are available on request from the corresponding author.
Acknowledgments
The authors acknowledge the support from the Institute of Materials Science and Engineering at the Chemnitz University of Technology and would like to thank Marc Pügner for the XRD measurements.
Conflicts of Interest
The authors declare no conflict of interest.
References
- Regulation (EC) No 1907/2006 of the European Parliament and of the Council of 18 December 2006 Concerning the Registration, Evaluation, Authorisation and Restriction of Chemicals (REACH), Establishing a European Chemicals Agency, Amending Directive 1999/4. 2017, 10, 1–21. Available online: http://data.europa.eu/eli/reg/2006/1907/2021-10-01 (accessed on 4 November 2021).
- Simão, J.; Aspinwall, D.K. Hard chromium plating of EDT mill work rolls. J. Mater. Process. Technol. 1999, 92–93, 281–287. [Google Scholar] [CrossRef]
- Podgornik, B.; Massler, O.; Kafexhiu, F.; Sedlacek, M. Crack density and tribological performance of hard-chrome coatings. Tribol. Int. 2018, 121, 333–340. [Google Scholar] [CrossRef]
- Pfeiffer, W.; Koplin, C.; Reisacher, E.; Wenzel, J. Residual stresses and strength of hard chromium coatings. Mater. Sci. Forum 2011, 681, 133–138. [Google Scholar] [CrossRef]
- Bertero, E.; Manzano, C.V.; Pellicer, E.; Sort, J.; Ulfig, R.M.; Mischler, S.; Michler, J.; Philippe, L. “Green” Cr(III)-glycine electrolyte for the production of FeCrNi coatings: Electrodeposition mechanisms and role of by-products in terms of coating composition and microstructure. RSC Adv. 2019, 9, 25762–25775. [Google Scholar] [CrossRef] [Green Version]
- Bertero, E.; Manzano, C.V.; Bürki, G.; Philippe, L. Stainless steel-like FeCrNi nanostructures via electrodeposition into AAO templates using a mixed-solvent Cr(III)-based electrolyte. Mater. Des. 2020, 190, 108559. [Google Scholar] [CrossRef]
- Hasegawa, M.; Yoon, S.; Guillonneau, G.; Zhang, Y.; Frantz, C.; Niederberger, C.; Weidenkaff, A.; Michler, J.; Philippe, L. The electrodeposition of FeCrNi stainless steel: Microstructural changes induced by anode reactions. Phys. Chem. Chem. Phys. 2014, 16, 26375–26384. [Google Scholar] [CrossRef]
- Philippe, L.; Heiss, C.; Michler, J. Electroplating of stainless steel. Chem. Mater. 2008, 20, 3377–3384. [Google Scholar] [CrossRef]
- Kang, J.C.; Lalvani, S.B.; Melendres, C.A. Electrodeposition and characterization of amorphous Fe-Ni-Cr-based alloys. J. Appl. Electrochem. 1995, 25, 376–383. [Google Scholar] [CrossRef]
- Adelkhani, H.; Arshadi, M.R. Properties of Fe-Ni-Cr alloy coatings by using direct and pulse current electrodeposition. J. Alloys Compd. 2009, 476, 234–237. [Google Scholar] [CrossRef]
- Meinhold, V.; Höhlich, D.; Dittes, A.; Mehner, T.; Lampke, T. Electrodeposition of FeCrNi and FeCr alloys and influence of heat treatment on microstructure and composition. IOP Conf. Ser. Mater. Sci. Eng. 2021, 1147, 012003. [Google Scholar] [CrossRef]
- Brittain, C.P.; Smith, G.C. A Preliminary Investigation of the formation of cracks in hard chromium electrodeposits and the evolution of hydrogen during deposition. Trans. IMF 1955, 33, 289–305. [Google Scholar] [CrossRef]
- Martyak, N.M.; McCaskie, J.E.; Voos, B.; Plieth, W. Microcracks in chromium electrodeposits. J. Mater. Sci. 1997, 32, 6069–6073. [Google Scholar] [CrossRef]
- Czerwinski, F.; Kedzierski, Z. On the mechanism of microcrack formation in nanocrystalline Fe-Ni electrodeposits. J. Mater. Sci. 1997, 32, 2957–2961. [Google Scholar] [CrossRef]
- Danilov, F.I.; Protsenko, V.S.; Butyrina, T.E.; Krasinskii, V.A.; Baskevich, A.S.; Kwon, S.C.; Lee, J.Y. Electrodeposition of nanocrystalline chromium coatings from cr(iii)-based electrolyte using pulsed current. Prot. Met. Phys. Chem. Surf. 2011, 47, 598–605. [Google Scholar] [CrossRef]
- El-Sharif, M.; McDougall, J.; Chisholm, C.U. Electrodeposition of thick chromium coatings from an environmentally acceptable chromium (III)-glycine complex. Trans. IMF 1999, 77, 139–144. [Google Scholar] [CrossRef]
- Zhang, Z.; Wang, Z.; Liang, B.; La, P. Effects of CeO2 on friction and wear characteristics of Fe-Ni-Cr alloy coatings. Tribol. Int. 2006, 39, 971–978. [Google Scholar] [CrossRef]
- Lin, K.L.; Hsu, C.J.; Hsu, I.M.; Chang, J.T. Electroplating of Ni-Cr on steel with pulse plating. J. Mater. Eng. Perform. 1992, 1, 359–361. [Google Scholar] [CrossRef]
- Gabe, D.R. The role of hydrogen in metal electrodeposition processes. J. Appl. Electrochem. 1997, 27, 908–915. [Google Scholar] [CrossRef]
- Leimbach, M.; Tschaar, C.; Schmidt, U.; Bund, A. Electrochemical characterization of chromium deposition from trivalent solutions for decorative applications by EQCM and near-surface pH measurements. Electrochim. Acta 2018, 270, 104–109. [Google Scholar] [CrossRef]
- Carlton, C.E.; Ferreira, P.J. What is behind the inverse Hall-Petch effect in nanocrystalline materials? Acta Mater. 2007, 55, 3749–3756. [Google Scholar] [CrossRef]
- Yousefi, E.; Irannejad, A.; Sharafi, S. Electrodeposition and characterization of nanocrystalline Fe−Ni−Cr alloy coatings synthesized via pulse current method. Trans. Nonferrous Met. Soc. China 2019, 29, 2591–2603. [Google Scholar] [CrossRef]
- Huang, C.A.; Li, K.C.; Lin, W.; Liao, M.C. The behavior of electroplated hard-chromium on Cr-Mo steel subject to long-term annealing at 250 °C. Mater. Sci. Eng. A 2005, 403, 222–226. [Google Scholar] [CrossRef]
- El-Sherik, A.; Erb, U.; Palumbo, G.; Aust, K. Deviations from hall-petch behaviour in as-prepared nanocrystalline nickel. Scr. Met. Mater. 1992, 27, 1185–1188. [Google Scholar] [CrossRef]
- Akram, W.; Mateen, A.; Qazi, I.; Hussain, A. Development and characterization of cost effective wear and corrosion resistant HVOF sprayed chromite coatings and hard chrome plating. In Proceedings of the 2019 16th International Bhurban Conference on Applied Sciences and Technology (IBCAST), Islamabad, Pakistan, 8–12 January 2019; pp. 66–73. [Google Scholar] [CrossRef]
- Bertero, E.; Hasegawa, M.; Staubli, S.; Pellicer, E.; Herrmann, I.K.; Sort, J.; Michler, J.; Philippe, L. Electrodeposition of amorphous Fe-Cr-Ni stainless steel alloy with high corrosion resistance, low cytotoxicity and soft magnetic properties. Surf. Coat. Technol. 2018, 349, 745–751. [Google Scholar] [CrossRef]
- Survilienė, S.; Nivinskienė, O.; Češunienė, A.; Selskis, A. Effect of Cr(III) solution chemistry on electrodeposition of chromium. J. Appl. Electrochem. 2006, 36, 649–654. [Google Scholar] [CrossRef]
- Haupt, S.; Strehblow, H.H. A combined surface analytical and electrochemical study of the formation of passive layers on Fe Cr alloys in 0.5 M H2SO4. Corros. Sci. 1995, 37, 43–54. [Google Scholar] [CrossRef]
Figure 1.
Method of area analysis (white) and method of point analysis (red) of EDXS measurements.

Figure 2.
EDXS measurements of (a) the oxygen content and (b) the chloride content for each deposition mode depending on the distance from the substrate and the electrolyte aging.
Figure 2.
EDXS measurements of (a) the oxygen content and (b) the chloride content for each deposition mode depending on the distance from the substrate and the electrolyte aging.

Figure 3.
EDXS measurements of alloy compositions over the entire layer thickness for each sample depending on the deposition mode and the electrolyte aging.
Figure 3.
EDXS measurements of alloy compositions over the entire layer thickness for each sample depending on the deposition mode and the electrolyte aging.

Figure 4.
Scanning electron microscopy micrographs of cross-sections of electrodeposited Fe-Cr-Ni coatings under DC conditions for three depositions (a) after first 2 h of electrolyte use and clear material chipping; (b) after second 2 h with slight vertical microcracks and (c) after third 2 h with clear microcracks.

Figure 5.
Scanning electron microscopy micrographs of cross-sections of electrodeposited Fe-Cr-Ni coatings under stepped DC conditions for three depositions (a) after first 2 h of electrolyte use with microcracks; (b) after second 2 h without any microcracks and (c) after third 2 h with few microcracks. Picture (d) shows a wider range of the Fe-Cr-Ni-layer with deposition parameters from coating (b).

Figure 6.
Scanning electron microscopy micrographs of cross-sections of electrodeposited Fe-Cr-Ni coatings under PC conditions for three depositions (a) after first 2 h of electrolyte use with clear microcracks, (b) after second 2 h with some thin microcracks, and (c) after third 2 h with only a small layer thickness but without any microcracks.

Figure 7.
XRD measurements of electrodeposited Fe-Cr-Ni layers in dependence of current mode.

Figure 8.
Martens and Vickers hardness of cross-section of electrodeposited Fe-Cr-Ni layers.

Figure 9.
Corrosion current density of electrodeposited Fe-Cr-Ni and hard-chrome layers.

Figure 10.
Current-density–potential curves of Fe-Cr-Ni layers and hard-chrome layers in 3.5% NaCl solution.
Figure 10.
Current-density–potential curves of Fe-Cr-Ni layers and hard-chrome layers in 3.5% NaCl solution.


Table 1.
Electrolyte composition.
| Chemicals | Formula | Concentration | |
|---|---|---|---|
| (mol/L) | (g/L) | ||
| Chromium(III) chlorid | CrCl3·6H2O | 0.40 | 106.58 |
| Glycine | C2H5NO2 | 0.40 | 30.03 |
| Iron(II) chlorid | FeCl2·4H2O | 0.03 | 5.96 |
| Nickel(II) chlorid | NiCl2·6H2O | 0.20 | 33.28 |
| Ammonium chlorid | NH4CL | 0.50 | 26.75 |
| Boric acid | H3BO3 | 0.15 | 9.27 |
| Sodium chloride | NaCl | 0.50 | 29.22 |
Table 2.
Coating parameters.
| Parameters | Value |
|---|---|
| Current density (A/dm2) | 12 |
| Effective coating time (min) | 120 |
| Temperature (°C) | 23 |
| Anode-cathode distance (mm) | 20 |
| Area ratio anode-cathode | 6:1 |
| Bath volume (mL) | 250 |
| Bath movement (rpm) | 150 |
| pH | 1 |
Table 3.
Composition (mass fractions w) and layer thickness d of the as-deposited layers.
| Samples | wCr (%) | wFe (%) | wNi (%) | wO (%) | wCl (%) | d (µm) |
|---|---|---|---|---|---|---|
| DC 1 | 24.4 ± 2.0 | 47.9 ± 1.3 | 15.5 ± 0.4 | 11.7 ± 2.5 | 0.6 ± 0.25 | 10.2 ± 1.2 |
| DC 2 | 32.3 ± 0.5 | 42.8 ± 1.6 | 13.5 ± 1.3 | 11.1 ± 0.8 | 0.4 ± 0.05 | 15.4 ± 2.3 |
| DC 3 | 49.2 ± 4.7 | 31.1 ± 4.1 | 7.3 ± 1.2 | 12.0 ± 0.6 | 0.5 ± 0.03 | 30.1 ± 4.9 |
| Stepped DC 1 | 26.4 ± 5.4 | 49.0 ± 4.4 | 12.1 ± 1.4 | 11.9 ± 0.6 | 0.5 ± 0.1 | 22.5 ± 1.4 |
| Stepped DC 2 | 25.7 ± 1.3 | 46.1 ± 2.1 | 15.8 ± 0.9 | 11.9 ± 0.5 | 0.6 ± 0.1 | 14.1 ± 2.1 |
| Stepped DC 3 | 27.9 ± 0.6 | 45.2 ± 2.5 | 14.7 ± 1.8 | 11.6 ± 1.1 | 0.5 ± 0.1 | 16.2 ± 1.9 |
| PC 1 | 15.1 ± 2.1 | 58.6 ± 2.4 | 17.9 ± 0.8 | 7.9 ± 0.8 | 0.6 ± 0.1 | 15.3 ± 1.2 |
| PC 2 | 11.8 ± 0.9 | 61.2 ± 2.2 | 19.1 ± 1.5 | 7.2 ± 0.3 | 0.6 ± 0.1 | 12.5 ± 1.1 |
| PC 3 | 15.5 ± 0.6 | 58.6 ± 2.0 | 16.5 ± 0.5 | 8.5 ± 1.8 | 0.9 ± 0.1 | 6.7 ± 1.2 |
Table 4.
Critical normal force Lc.
| Sample | DC 2 | Stepped DC 2 | PC 2 |
|---|---|---|---|
| Lc (N) | 19 ± 4 | 21 ± 4 | 21 ± 1 |
Table 5.
Corrosion current density icorr and corrosion potential Ecorr values in 3.5% NaCl solution.
Table 5.
Corrosion current density icorr and corrosion potential Ecorr values in 3.5% NaCl solution.
| Sample | DC 2 | Stepped DC 2 | PC 2 | Hard Chrome | Stainless Steel |
|---|---|---|---|---|---|
| icorr (mA/dm2) | 0.147 | 0.118 | 0.249 | 0.006 | 0.002 |
| Ecorr (mV) | 54.5 | −74.2 | −249.1 | −231.1 | 303.4 |
Publisher’s Note: MDPI stays neutral with regard to jurisdictional claims in published maps and institutional affiliations. |
© 2022 by the authors. Licensee MDPI, Basel, Switzerland. This article is an open access article distributed under the terms and conditions of the Creative Commons Attribution (CC BY) license (https://creativecommons.org/licenses/by/4.0/).
Share and Cite
MDPI and ACS Style
Meinhold, V.; Höhlich, D.; Mehner, T.; Lampke, T. Electrodeposition of Thick and Crack-Free Fe-Cr-Ni Coatings from a Cr (III) Electrolyte. Coatings 2022, 12, 56. https://doi.org/10.3390/coatings12010056
AMA Style
Meinhold V, Höhlich D, Mehner T, Lampke T. Electrodeposition of Thick and Crack-Free Fe-Cr-Ni Coatings from a Cr (III) Electrolyte. Coatings. 2022; 12(1):56. https://doi.org/10.3390/coatings12010056
Chicago/Turabian StyleMeinhold, Vanessa, Dominik Höhlich, Thomas Mehner, and Thomas Lampke. 2022. "Electrodeposition of Thick and Crack-Free Fe-Cr-Ni Coatings from a Cr (III) Electrolyte" Coatings 12, no. 1: 56. https://doi.org/10.3390/coatings12010056
Note that from the first issue of 2016, this journal uses article numbers instead of page numbers. See further details here.