Big Data Business Model Maturity Index Guide
Bill Schmarzo
Dean of Big Data, CDO Chief AI Officer Whisperer, recognized global innovator, educator, and practitioner in Big Data, Data Science, & Design Thinking
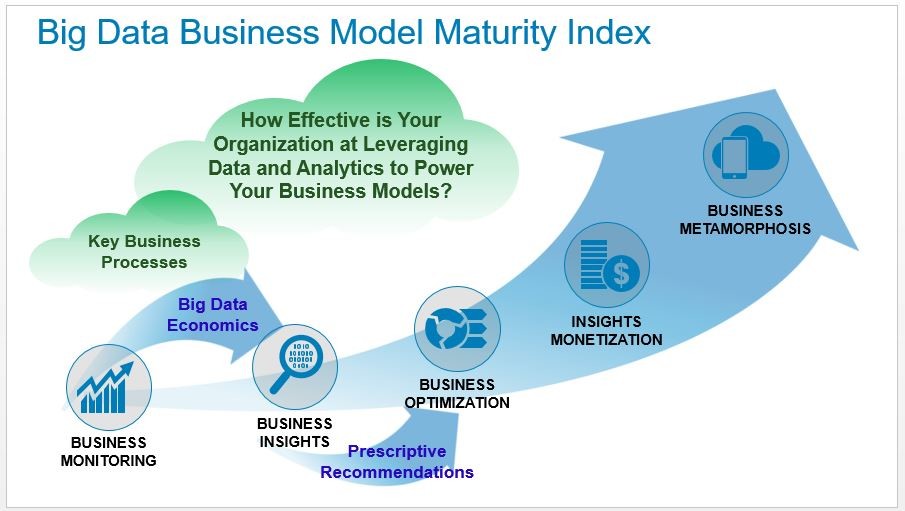
We developed the Big Data Business Model Maturity Index to help organizations measure how effective they were at leveraging data and analytics to power their business models (see Figure 1).

Figure 1: Big Data Business Model Maturity Index
What we hadn’t done until now, though, was to translate this index into a set of recommendations or actions to help organizations advance from one stage to the next. That’s the objective of this blog (and maybe my next book…God forbid!!!): to give our clients a checklist of actions to facilitate progressing along the Big Data Business Model Maturity Index.
Understanding The Big Data Business Model Maturity Index
The vast majority of organizations with which I meet are stuck in Phase 1: the Business Monitoring phase. In this phase, organizations are using Business Intelligence (BI) and data warehousing tools to monitor the business; providing a retrospective, batch view of what the business has accomplished. And while this is a critical foundation upon which to build big data capabilities, organizations have learned that they cannot become a real-time, predictive and prescriptive data-driven organization using these BI and data warehouse tools. Organizations need something more, which is where the Big Data Business Model Maturity Index comes into play.
So what are the steps that an organization needs to accomplish in order to advance itself through the Big Data Business Model Maturity Index? What actions do organizations need to take in order to become a more real-time, more predictive and prescriptive organization that is capable of monetizing opportunities with Big Data and developing entirely new business models around these new insights? Organizations need a prescriptive guide (and future Big Data MBA course?) to progress through the Big Data Business Model Maturity Index; to become more effective at leveraging data and analytics to power their business models.
Steps to Progress from Monitoring to Insights
The Insights stage is about coupling the wealth of internal and external data with predictive analytics (and even machine learning) to uncover insights about the organization’s key (internal) business processes, product and service attributes, and/or customer behaviors and sentiments. Key actions required to transition from the Monitoring to the Insights stage include:
- Identify Key Business Decisions. Identify and understand the decisions that the key business stakeholders need to make to support an organization’s key business initiatives (e.g., “Reversing financial trading platform market share loss”)
- Create Analytics Sandbox. Provide an analytics environment that allows the data scientists to rapidly ingest data (as-is; no schema required), explore the data, and test the data for its predictive capabilities in a fail fast environment that includes:
- Historical detailed operational and transactional data at the most granular (individual investor, adviser or trader) level
- Internal unstructured data about engagements and conversations (consumer comments, surveys, advisor notes, email conversations, etc.) with individual investors, advisers or traders
- External unstructured data about individual investors, advisers or traders publicly available activities (social media postings, property values, property taxes, college donations, job promotions)
- Deploy Predictive Analytics. Leverage predictive analytics and machine learning to mine the above wealth of data to uncover individuals’ relevant behaviors (e.g., trading and engagement tendencies, propensities, preferences, patterns, trends, interests, passions, affiliations, associations, sentiment)
- Build Analytic Profiles. Create individual Analytic Profiles for the key individuals (e.g., investors, traders, advisors, portfolio managers) that includes basic demographic data (age, income level, education level, number of dependents, etc.) coupled with advanced demographic data (value of home, donations, vacations, travel, age to retirement, etc.) as well as “scores” that support the organization’s key business initiatives (e.g., Customer LTV, FICO, Retirement Readiness, Risk Tolerance, Children’s College Funding, Legacy Giving)
- Deploy Right-time Analytics. Create a “Right time” analytics capabilities that can monitor individuals’ behaviors (across individuals’ transactions, engagements, events, activities, etc.) to flag behavioral changes or insights that might be worthy of analysis.
- Train Business Users. Train business users in a process to think creatively (“Thinking Like A Data Scientist”) about identifying data sources, variables and metrics that could potentially be better predictors of business or individual performance
- Capture Insights. Capture and catalogue the insights that are being uncovered about your key business entities (e.g., customers, products, operations, markets) for review and assessment in the Optimization phase of the Big Data Business Model Maturity Index.
Steps to Progress from Insights to Optimization
The Optimization stage applies prescriptive analytics to the customer, product, operational and market insights to deliver recommendations to front-line employees, partners and customers to improve effectiveness of the organization’s key (internal) business processes. Key actions required to transition from the Insights to the Optimization stage include:
- Evaluate Insights Business Relevance. Train business subject matter experts to assess the potential value of each of the customer, product, operational and market insights using the A.M. Test:
- Are the insights Strategic for the targeted business initiative?
- Are the insights Actionable?
- Are the insights Material (i.e., the value of acting is greater than the cost of acting)?
- Deploy Prescriptive Analytics. For insights that pass the S.A.M. Test, build prescriptive analytics to deliver actionable recommendations to the key business entities (investors, advisers, partners, agents, portfolio managers, etc.) that support the key decisions for the targeted business process
- Deploy Data Lake. Build a Data Lake that supports rapid data ingestion, data engineering, data exploration and analytic modeling. Key characteristics of a data lake include:
- Captures data from a wide range of traditional and new sources as-is (structured and unstructured)
- Enables you to store all your data in one environment for cross-functional business analysis
- Enables in-place predictive analytics to uncover new customer, product, and operational insights
- Enables prescriptive analytics to create recommendations that empower front-line employees and drive more profitable customer engagement
- Enables the integration of the analytic results (scores, recommendations, rules) into operational and management systems
- Leverage App Dev. Operationalize the recommendations by leveraging modern app/dev techniques to integrate the results with web-based, mobile app, dashboards, reports., This delivers the recommendations, scores and rules in a way that lets the business stakeholders consume them easily.
- Measure Decision Effectiveness. Instrument or configure the recommendations in order to determine the effectiveness of the recommendations (i.e., did the recommendations work as predicted). Use the results of the effectiveness measurements to finetune the analytic models.
Steps to Progress from Optimization to Monetization
The Monetization stage leverages the approach from the Optimization phase to identify and execute on new (external) business opportunities within the context of the organization’s existing business strategy. Key actions required to transition from the Optimization to the Monetization stage include:
- Categorize Analytic Insights. Capture and catalogue the captured customer, product, operational and market insights in the data lake and/or analytic sandbox, and then validate the business relevance and business potential of those insights
- Codify Monetization Opportunities. Decompose short-to-medium term business strategy and key business initiatives for growth to understand what the organization wants to accomplish and how data insight could accelerate those initiatives. Run envisioning exercises with key business subject matter experts (SME’s) to review and assess the value of insights as they relate to growth opportunities. New business opportunities typically fall into the areas of new products, services, channels, audiences, markets, and/or partners.
- Prove ROI. Provide a Proof of Value environment where the data science team can collaborate with the business SME’s to determine if the analytics can be turned into new business opportunities (i.e., validate market size and market share potential, determine the analytic lift and range of Return on Investment); determine how would these insights be used to identify and launch new market or revenue initiatives?
- Operationalize New Products/Services. If there is a compelling ROI and the analytic models can generate the necessary lift, then push the new monetization opportunities to market launch. Instrument the rollout to monitor the monetization effectiveness and make right-time course corrections.
Steps to Progress from Monetization to Metamorphosis
The Metamorphosis stage leverages the organization’s cumulative insights, data and analytics to create net new components of the business strategy – new business models, new consumption models, new corporate goals, new BHAGs! Key actions required to transition from the Monetization stage to the Metamorphosis stage include:
- Create New Customer Consumption Models. Consider your customers’ financial reasons for doing business with you; why and how are your customers making purchasing decisions and how can you improve the effectiveness and timeliness of those decisions. Create new consumption models (e.g., convert CapEx to OpEx), and additional products/services that deliver connective value.
- Create Analytics Platform. Extend your analytics platform to incorporate customer-facing interactivity (think GE Predix or Apple App Store) where customers can develop new apps that integrate into their business operations (business models).
- Enable Third-Party App Developers. Determine how to enable, scale and secure the analytics platform so that third-party application developers can develop, market, sell and support new value-added applications (think Apple App Store and Google Play)
Big Data Business Model Maturity Index Summary
Figure 2 summarizes the steps in the process of becoming more effective at leveraging data and analytics to power the business.

Figure 2: Big Data Business Model Maturity Index Guide
This is a process that any organization can follow. However, resist the urge to jump to step 3 or 4 in the process, and resist the urge to just throw technology at the opportunity and hope that everything works out. Hope is only a strategy if you are in the cosmetics business, but the rest of us need a guide.
MSc International Business Management | HDFC Bank | MBA-IB (Marketing) SIIB | AIT
1yWhat level is Coca-Cola on?
Insurance Law Specialist | Public Liability | Professional Indemnity | Life Insurance | Defamation Lawyer
6yA really practical write up Bill, very useful! Where did you get the info from?