


FigJamKeep moving parts on track with our network diagram examples
See how everything connects, whether that’s the computers and servers on a network or the employees who use them for exciting project activity. Control and visualize the flow of information between systems and teams with FigJam’s diagramming templates.


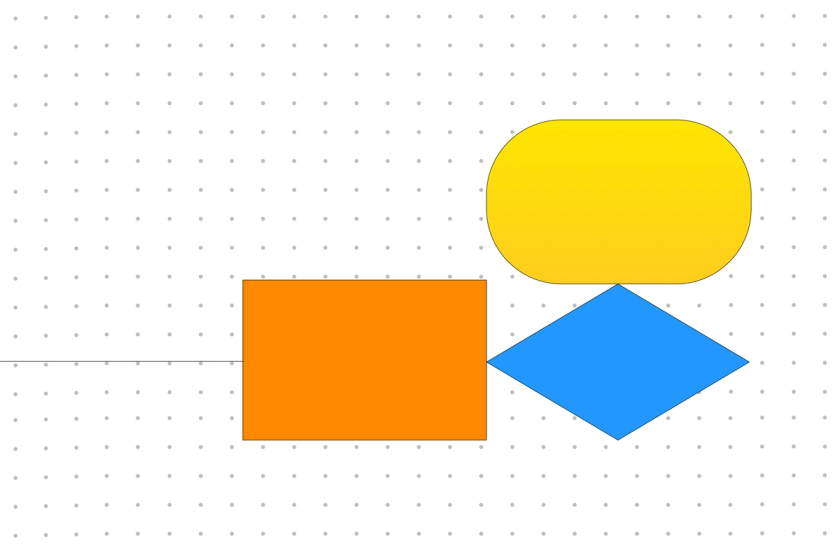
Network diagram
Get your head out of the cloud and collectively map out deadlines and a project schedule that works for the entire team.

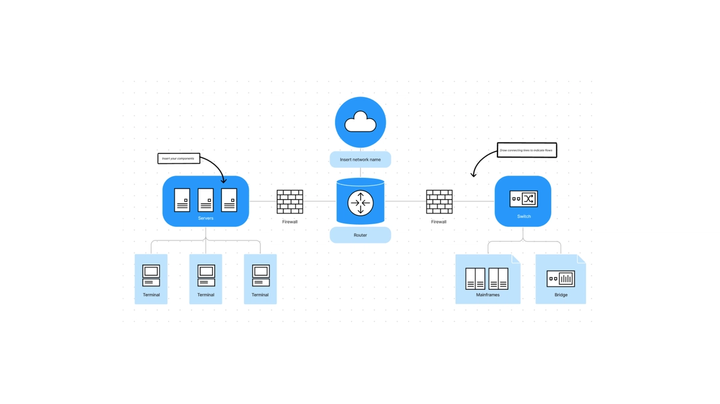
For industry-leading network connectivity
Easily exchange information with your entire team by defining a project’s components, how they connect, and how one leads to the next.
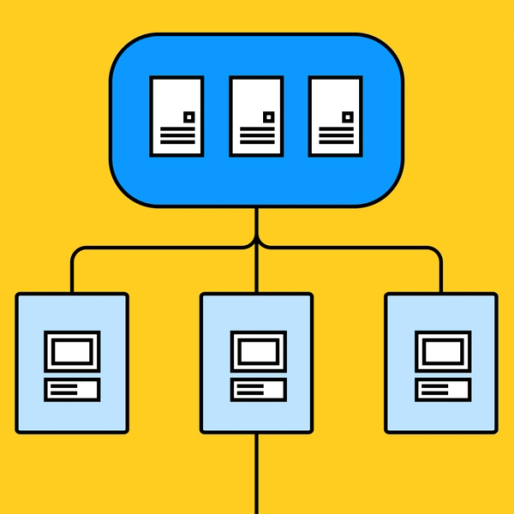
Make headway—and track it: Meet project deadlines and keep your team motivated when you document the big-picture overview and your progress at various steps.
Depend on each other: Encourage collaboration by highlighting a project or system’s interdependencies with a shared network diagram tool.
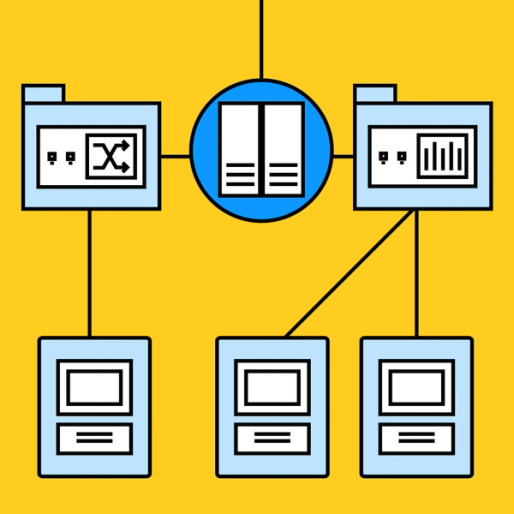
Find your flow: Sketch out connection points, whether between internal and external IT equipment or the start and finish of a project.


FigJamNo missing links or dropped connections
Add every member of your team to your shared network by collaborating on FigJam. With chat and commenting functions, open workspaces, and convenient community-built widgets to refine key details in your project plan, you’ll never find yourself in a dead zone.
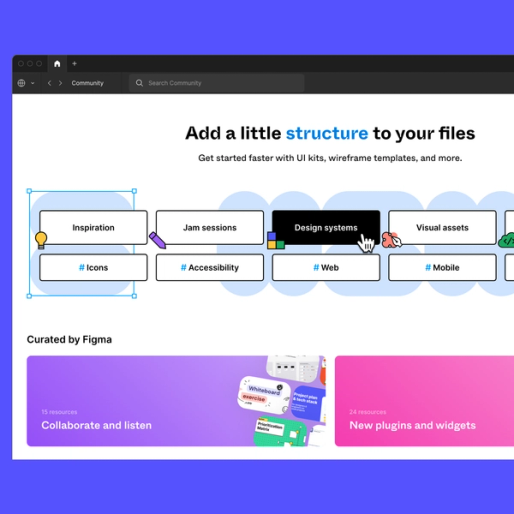
Everything’s connected
Layout core business processes, project pipelines, or server systems with a network diagram template. Then, find new connections with more templates from our Community.


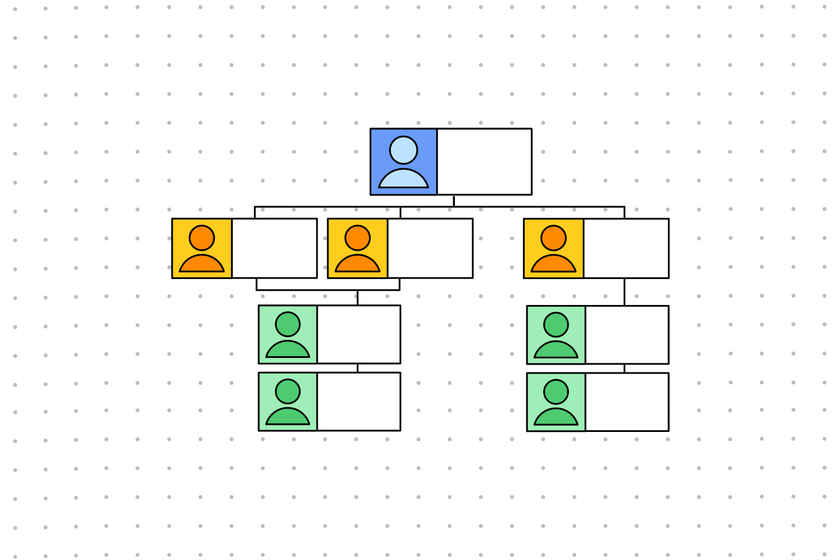
Team meeting agenda
Put “create a network diagram” on the to-do list for your next team meeting.

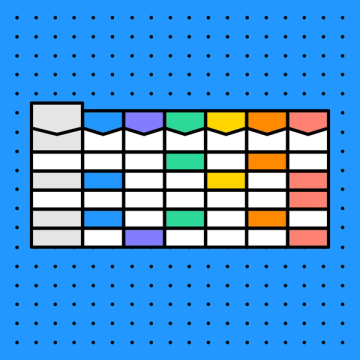
RACI matrix
Keep track of responsibilities so team members know where to turn for information or help.


Other templates from the community
Build a stronger collaborative process when you incorporate planning and analysis from all angles.
FAQs
A network diagram visually represents the interconnectivity of various components. Originally used to map out literal networks (complete with firewalls, routers, servers, and devices), network diagram tools are now commonly used in project management as a means to connect the various steps in a process, what they depend upon, and what comes next.
These graphs are helpful in keeping track of multiple moving parts, scheduling a project from start to finish, and supporting collaboration within a team. Network diagrams also pair easily with other planning tools such as Kanban boards and to-do lists that break down each step even further.
Start by downloading FigJam’s editable network diagram template. Add icons to the shared whiteboard that represent the start and endpoints of your task duration, filling in independent and dependent steps as you go to build out an entire schedule and scope. Map out all the pathways necessary to complete your project, assigning a duration of time to each. Discuss the timeframes with your team to make sure they are as accurate as possible.
To make the most of your finished product, you’ll want to know how to identify a critical path in network diagram examples. The critical path is the longest sequence of a task dependency your team has to perform to finish the project, which will tell you the shortest possible time it would take to finish the project.
Read your network diagram sample from left to right—start to finish. Each box in between these two points represents a task and is usually labeled with the task duration it takes to complete it. The tasks that directly follow will depend upon the completion of that particular job. Follow the various trajectories and offshoots across the diagram to plot your order of operations and assign an estimated deadline to your project.
Other templates you might like


Explore 1,000+ templates on the Figma community
Explore even more templates, widgets, and plugins—all built by the Figma community.